29
/
en
AIzaSyAYiBZKx7MnpbEhh9jyipgxe19OcubqV5w
April 1, 2024
73576
Australia
AUS
true
2
1
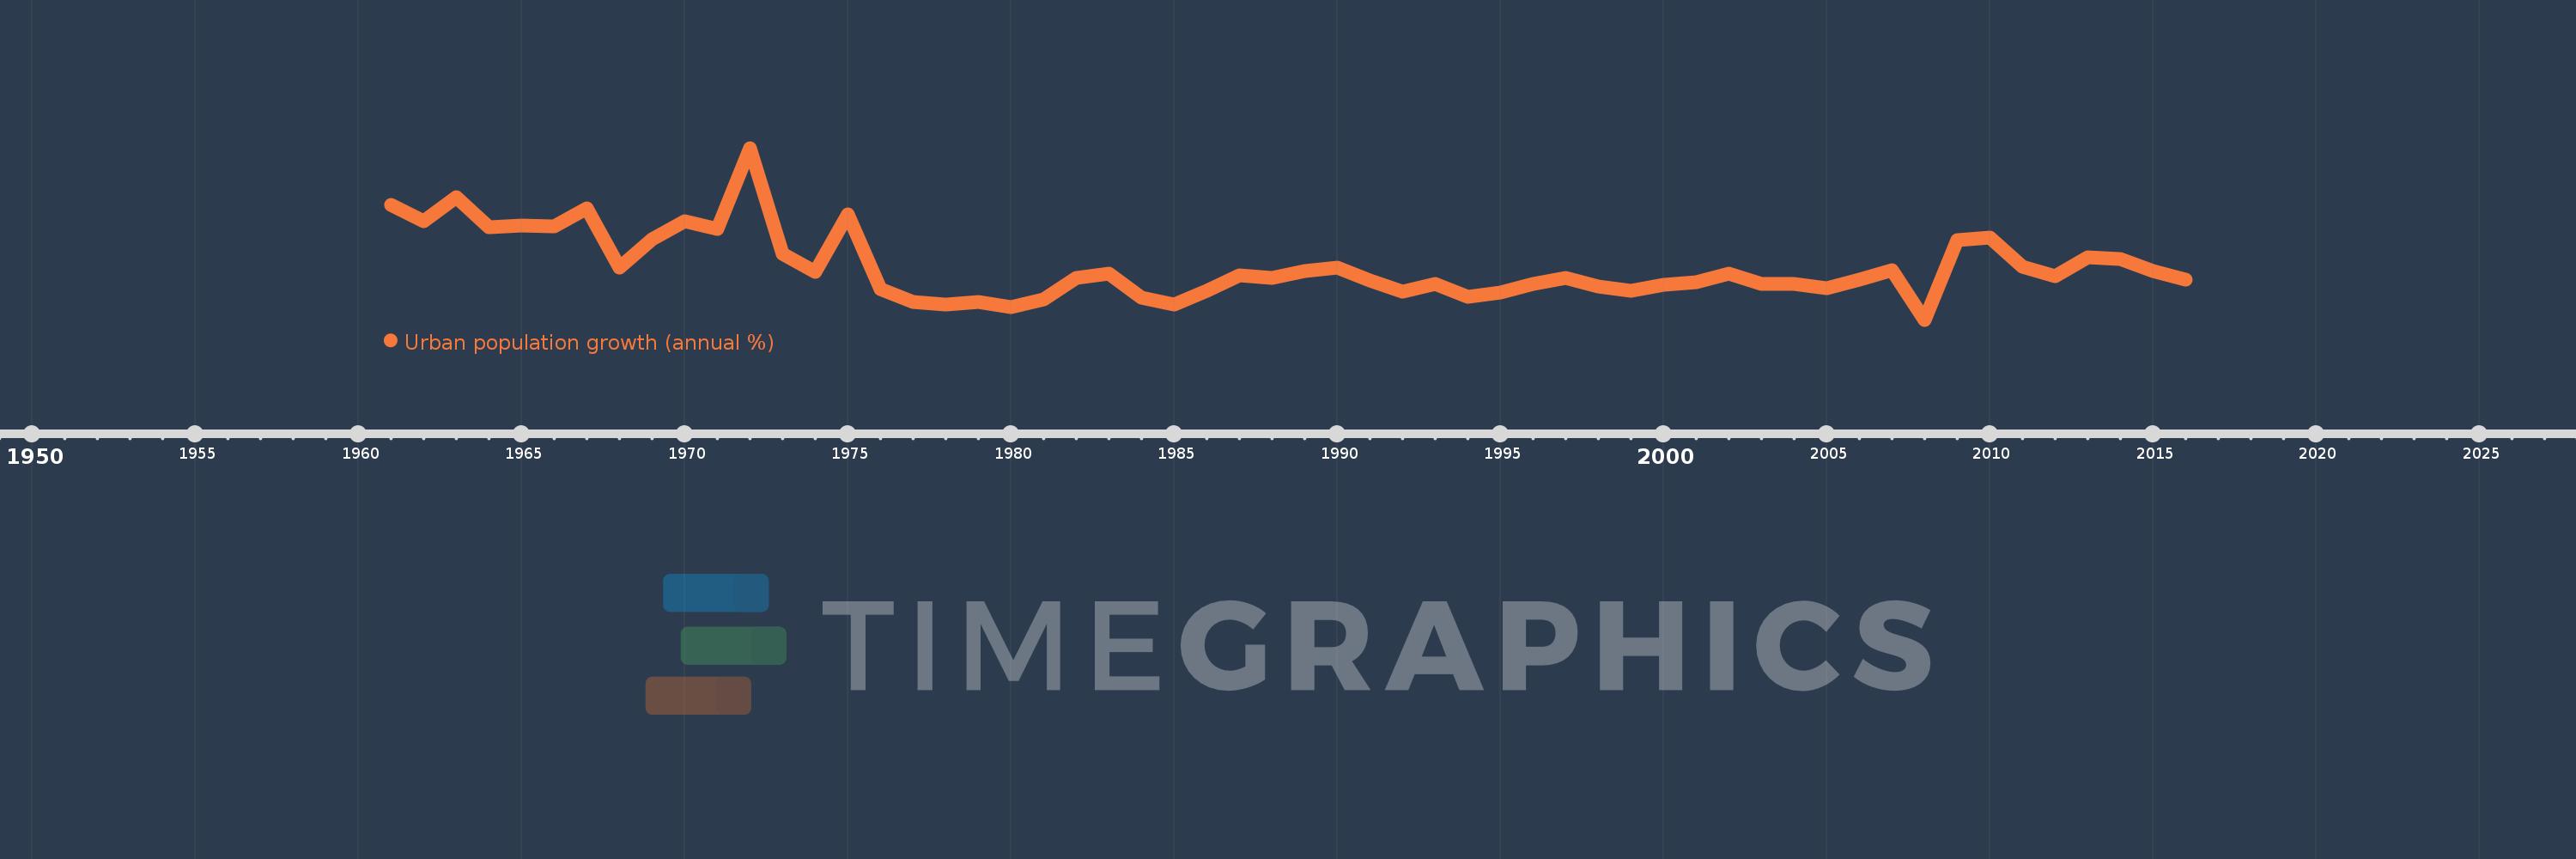
Urban population growth (annual %)
2016,2015,2014,2013,2012,2011,2010,2009,2008,2007,2006,2005,2004,2003,2002,2001,2000,1999,1998,1997,1996,1995,1994,1993,1992,1991,1990,1989,1988,1987,1986,1985,1984,1983,1982,1981,1980,1979,1978,1977,1976,1975,1974,1973,1972,1971,1970,1969,1968,1967,1966,1965,1964,1963,1962,1961
This statistics in other country:
AfghanistanAlbaniaAlgeriaAmerican SamoaAndorraAngolaAntigua and BarbudaArab WorldArgentinaArmeniaArubaAustraliaAustriaAzerbaijanBahamas, TheBahrainBangladeshBarbadosBelarusBelgiumBelizeBeninBermudaBhutanBoliviaBosnia and HerzegovinaBotswanaBrazilBritish Virgin IslandsBrunei DarussalamBulgariaBurkina FasoBurundiCabo VerdeCambodiaCameroonCanadaCaribbean small statesCayman IslandsCentral African RepublicCentral Europe and the BalticsChadChannel IslandsChileChinaColombiaComorosCongo, Dem. Rep.Congo, Rep.Costa RicaCote d'IvoireCroatiaCubaCuracaoCyprusCzech RepublicDenmarkDjiboutiDominicaDominican RepublicEarly-demographic dividendEast Asia & PacificEast Asia & Pacific (excluding high income)East Asia & Pacific (IDA & IBRD countries)EcuadorEgypt, Arab Rep.El SalvadorEquatorial GuineaEritreaEstoniaEthiopiaEuro areaEurope & Central AsiaEurope & Central Asia (excluding high income)Europe & Central Asia (IDA & IBRD countries)European UnionFaroe IslandsFijiFinlandFragile and conflict affected situationsFranceFrench PolynesiaGabonGambia, TheGeorgiaGermanyGhanaGibraltarGreeceGreenlandGrenadaGuamGuatemalaGuineaGuinea-BissauGuyanaHaitiHeavily indebted poor countries (HIPC)High incomeHondurasHong Kong SAR, ChinaHungaryIBRD onlyIcelandIDA & IBRD totalIDA blendIDA onlyIDA totalIndiaIndonesiaIran, Islamic Rep.IraqIrelandIsle of ManIsraelItalyJamaicaJapanJordanKazakhstanKenyaKiribatiKorea, Dem. People’s Rep.Korea, Rep.KuwaitKyrgyz RepublicLao PDRLate-demographic dividendLatin America & Caribbean Latin America & Caribbean (excluding high income)Latin America & the Caribbean (IDA & IBRD countries)LatviaLeast developed countries: UN classificationLebanonLesothoLiberiaLibyaLiechtensteinLithuaniaLow & middle incomeLow incomeLower middle incomeLuxembourgMacao SAR, ChinaMacedonia, FYRMadagascarMalawiMalaysiaMaldivesMaliMaltaMarshall IslandsMauritaniaMauritiusMexicoMicronesia, Fed. Sts.Middle East & North AfricaMiddle East & North Africa (excluding high income)Middle East & North Africa (IDA & IBRD countries)Middle incomeMoldovaMonacoMongoliaMontenegroMoroccoMozambiqueMyanmarNamibiaNauruNepalNetherlandsNew CaledoniaNew ZealandNicaraguaNigerNigeriaNorth AmericaNorthern Mariana IslandsNorwayOECD membersOmanOther small statesPacific island small statesPakistanPalauPanamaPapua New GuineaParaguayPeruPhilippinesPolandPortugalPost-demographic dividendPre-demographic dividendPuerto RicoQatarRomaniaRussian FederationRwandaSamoaSan MarinoSao Tome and PrincipeSaudi ArabiaSenegalSerbiaSeychellesSierra LeoneSingaporeSint Maarten (Dutch part)Slovak RepublicSloveniaSmall statesSolomon IslandsSomaliaSouth AfricaSouth AsiaSouth Asia (IDA & IBRD)South SudanSpainSri LankaSt. Kitts and NevisSt. LuciaSt. Vincent and the GrenadinesSub-Saharan Africa Sub-Saharan Africa (excluding high income)Sub-Saharan Africa (IDA & IBRD countries)SudanSurinameSwazilandSwedenSwitzerlandSyrian Arab RepublicTajikistanTanzaniaThailandTimor-LesteTogoTongaTrinidad and TobagoTunisiaTurkeyTurkmenistanTurks and Caicos IslandsTuvaluUgandaUkraineUnited Arab EmiratesUnited KingdomUnited StatesUpper middle incomeUruguayUzbekistanVanuatuVenezuela, RBVietnamVirgin Islands (U.S.)West Bank and GazaWorldYemen, Rep.ZambiaZimbabwe Timeline:
This timeline shows a graph from 1961 to 2016 of Australia. No data until 1960. Number of actual observations by date: 56.
Source name:
World Development Indicators
Source organization:
World Bank Staff estimates based on United Nations, World Urbanization Prospects.
Categories, topics:
Climate Change, Urban Development
Last updated:
apr 23, 2017
Indicators value changes by year
At the date of observation
Value
Absolute change
Change from previous value
jan 1, 1961
2.783
+2.783
0.0%
jan 1, 1962
2.494
-0.29
-10.4%
jan 1, 1963
2.923
+0.429
17.2%
jan 1, 1964
2.39
-0.532
-18.22%
jan 1, 1965
2.424
+0.034
1.42%
jan 1, 1966
2.41
-0.014
-0.59%
jan 1, 1967
2.725
+0.315
13.09%
jan 1, 1968
1.693
-1.032
-37.88%
jan 1, 1969
2.186
+0.493
29.12%
jan 1, 1970
2.505
+0.319
14.59%
jan 1, 1971
2.373
-0.132
-5.25%
jan 1, 1972
3.772
+1.399
58.95%
jan 1, 1973
1.933
-1.84
-48.77%
jan 1, 1974
1.622
-0.311
-16.07%
jan 1, 1975
2.624
+1.002
61.79%
jan 1, 1976
1.324
-1.3
-49.54%
jan 1, 1977
1.095
-0.23
-17.35%
jan 1, 1978
1.057
-0.038
-3.44%
jan 1, 1979
1.094
+0.037
3.53%
jan 1, 1980
1.011
-0.083
-7.63%
jan 1, 1981
1.148
+0.137
13.56%
jan 1, 1982
1.517
+0.369
32.15%
jan 1, 1983
1.597
+0.081
5.32%
jan 1, 1984
1.18
-0.417
-26.11%
jan 1, 1985
1.062
-0.118
-10.03%
jan 1, 1986
1.297
+0.235
22.13%
jan 1, 1987
1.569
+0.272
20.94%
jan 1, 1988
1.521
-0.048
-3.05%
jan 1, 1989
1.636
+0.115
7.58%
jan 1, 1990
1.693
+0.056
3.44%
jan 1, 1991
1.48
-0.213
-12.56%
jan 1, 1992
1.275
-0.205
-13.88%
jan 1, 1993
1.408
+0.133
10.44%
jan 1, 1994
1.191
-0.217
-15.4%
jan 1, 1995
1.268
+0.077
6.5%
jan 1, 1996
1.415
+0.147
11.57%
jan 1, 1997
1.519
+0.104
7.37%
jan 1, 1998
1.375
-0.145
-9.52%
jan 1, 1999
1.3
-0.075
-5.44%
jan 1, 2000
1.396
+0.096
7.4%
jan 1, 2001
1.443
+0.047
3.36%
jan 1, 2002
1.592
+0.15
10.38%
jan 1, 2003
1.407
-0.185
-11.65%
jan 1, 2004
1.41
+0.003
0.2%
jan 1, 2005
1.335
-0.075
-5.32%
jan 1, 2006
1.492
+0.157
11.74%
jan 1, 2007
1.646
+0.154
10.33%
jan 1, 2008
0.792
-0.853
-51.84%
jan 1, 2009
2.17
+1.378
173.89%
jan 1, 2010
2.225
+0.054
2.51%
jan 1, 2011
1.717
-0.508
-22.84%
jan 1, 2012
1.549
-0.167
-9.75%
jan 1, 2013
1.88
+0.331
21.35%
jan 1, 2014
1.852
-0.028
-1.48%
jan 1, 2015
1.641
-0.211
-11.4%
jan 1, 2016
1.492
-0.149
-9.07%
Ranking of countries by current statistics by years


Comments: