29
/
en
AIzaSyAYiBZKx7MnpbEhh9jyipgxe19OcubqV5w
April 1, 2024
128982
Eritrea
ERI
true
2
1
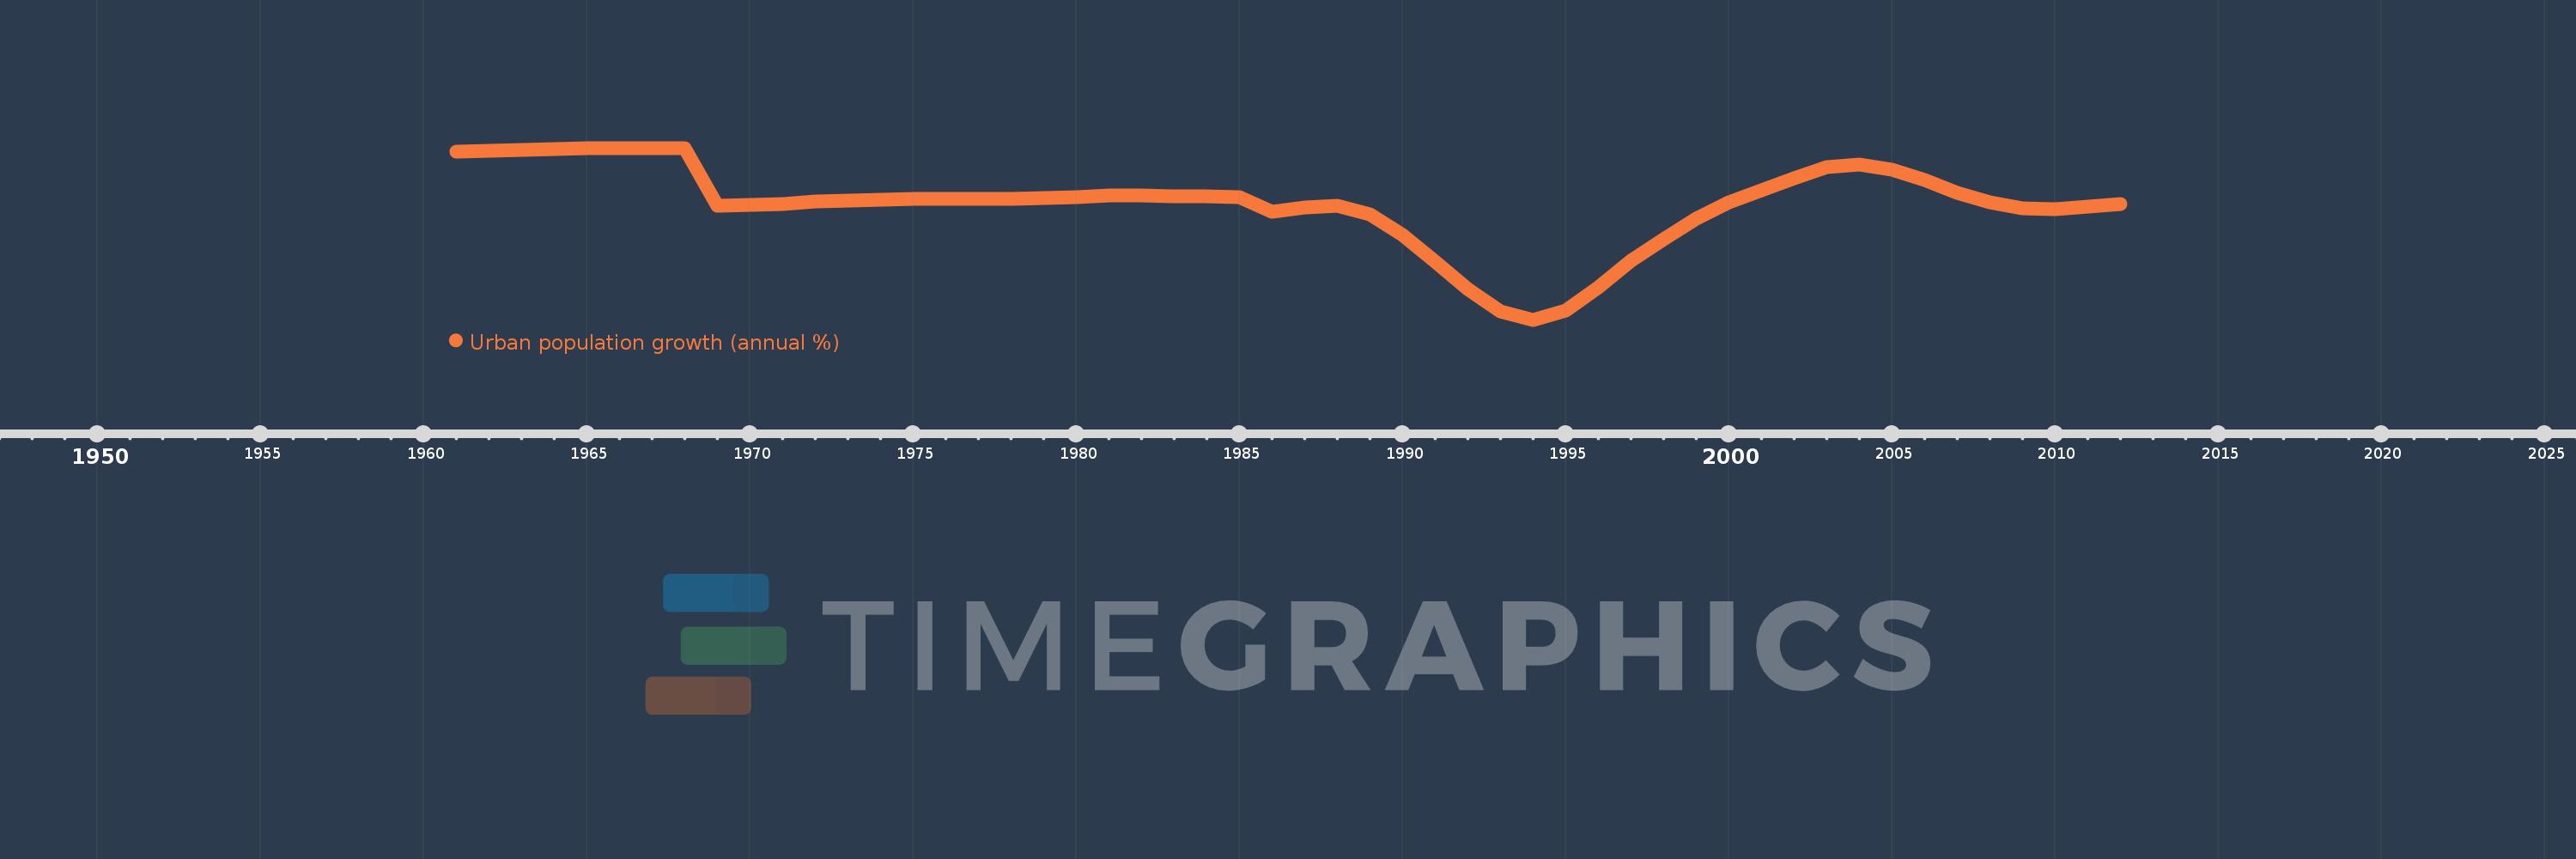
Urban population growth (annual %)
2012,2011,2010,2009,2008,2007,2006,2005,2004,2003,2002,2001,2000,1999,1998,1997,1996,1995,1994,1993,1992,1991,1990,1989,1988,1987,1986,1985,1984,1983,1982,1981,1980,1979,1978,1977,1976,1975,1974,1973,1972,1971,1970,1969,1968,1967,1966,1965,1964,1963,1962,1961
This statistics in other country:
AfghanistanAlbaniaAlgeriaAmerican SamoaAndorraAngolaAntigua and BarbudaArab WorldArgentinaArmeniaArubaAustraliaAustriaAzerbaijanBahamas, TheBahrainBangladeshBarbadosBelarusBelgiumBelizeBeninBermudaBhutanBoliviaBosnia and HerzegovinaBotswanaBrazilBritish Virgin IslandsBrunei DarussalamBulgariaBurkina FasoBurundiCabo VerdeCambodiaCameroonCanadaCaribbean small statesCayman IslandsCentral African RepublicCentral Europe and the BalticsChadChannel IslandsChileChinaColombiaComorosCongo, Dem. Rep.Congo, Rep.Costa RicaCote d'IvoireCroatiaCubaCuracaoCyprusCzech RepublicDenmarkDjiboutiDominicaDominican RepublicEarly-demographic dividendEast Asia & PacificEast Asia & Pacific (excluding high income)East Asia & Pacific (IDA & IBRD countries)EcuadorEgypt, Arab Rep.El SalvadorEquatorial GuineaEritreaEstoniaEthiopiaEuro areaEurope & Central AsiaEurope & Central Asia (excluding high income)Europe & Central Asia (IDA & IBRD countries)European UnionFaroe IslandsFijiFinlandFragile and conflict affected situationsFranceFrench PolynesiaGabonGambia, TheGeorgiaGermanyGhanaGibraltarGreeceGreenlandGrenadaGuamGuatemalaGuineaGuinea-BissauGuyanaHaitiHeavily indebted poor countries (HIPC)High incomeHondurasHong Kong SAR, ChinaHungaryIBRD onlyIcelandIDA & IBRD totalIDA blendIDA onlyIDA totalIndiaIndonesiaIran, Islamic Rep.IraqIrelandIsle of ManIsraelItalyJamaicaJapanJordanKazakhstanKenyaKiribatiKorea, Dem. People’s Rep.Korea, Rep.KuwaitKyrgyz RepublicLao PDRLate-demographic dividendLatin America & Caribbean Latin America & Caribbean (excluding high income)Latin America & the Caribbean (IDA & IBRD countries)LatviaLeast developed countries: UN classificationLebanonLesothoLiberiaLibyaLiechtensteinLithuaniaLow & middle incomeLow incomeLower middle incomeLuxembourgMacao SAR, ChinaMacedonia, FYRMadagascarMalawiMalaysiaMaldivesMaliMaltaMarshall IslandsMauritaniaMauritiusMexicoMicronesia, Fed. Sts.Middle East & North AfricaMiddle East & North Africa (excluding high income)Middle East & North Africa (IDA & IBRD countries)Middle incomeMoldovaMonacoMongoliaMontenegroMoroccoMozambiqueMyanmarNamibiaNauruNepalNetherlandsNew CaledoniaNew ZealandNicaraguaNigerNigeriaNorth AmericaNorthern Mariana IslandsNorwayOECD membersOmanOther small statesPacific island small statesPakistanPalauPanamaPapua New GuineaParaguayPeruPhilippinesPolandPortugalPost-demographic dividendPre-demographic dividendPuerto RicoQatarRomaniaRussian FederationRwandaSamoaSan MarinoSao Tome and PrincipeSaudi ArabiaSenegalSerbiaSeychellesSierra LeoneSingaporeSint Maarten (Dutch part)Slovak RepublicSloveniaSmall statesSolomon IslandsSomaliaSouth AfricaSouth AsiaSouth Asia (IDA & IBRD)South SudanSpainSri LankaSt. Kitts and NevisSt. LuciaSt. Vincent and the GrenadinesSub-Saharan Africa Sub-Saharan Africa (excluding high income)Sub-Saharan Africa (IDA & IBRD countries)SudanSurinameSwazilandSwedenSwitzerlandSyrian Arab RepublicTajikistanTanzaniaThailandTimor-LesteTogoTongaTrinidad and TobagoTunisiaTurkeyTurkmenistanTurks and Caicos IslandsTuvaluUgandaUkraineUnited Arab EmiratesUnited KingdomUnited StatesUpper middle incomeUruguayUzbekistanVanuatuVenezuela, RBVietnamVirgin Islands (U.S.)West Bank and GazaWorldYemen, Rep.ZambiaZimbabwe Timeline:
This timeline shows a graph from 1961 to 2012 of Eritrea. No data until 1960. Number of actual observations by date: 52.
Source name:
World Development Indicators
Source organization:
World Bank Staff estimates based on United Nations, World Urbanization Prospects.
Categories, topics:
Climate Change, Urban Development
Last updated:
apr 23, 2017
Indicators value changes by year
At the date of observation
Value
Absolute change
Change from previous value
jan 1, 1961
5.457
+5.457
0.0%
jan 1, 1962
5.473
+0.016
0.29%
jan 1, 1963
5.514
+0.04
0.73%
jan 1, 1964
5.525
+0.012
0.21%
jan 1, 1965
5.548
+0.023
0.41%
jan 1, 1966
5.546
-0.002
-0.03%
jan 1, 1967
5.558
+0.011
0.2%
jan 1, 1968
5.56
+0.003
0.05%
jan 1, 1969
3.881
-1.679
-30.2%
jan 1, 1970
3.91
+0.029
0.76%
jan 1, 1971
3.954
+0.043
1.11%
jan 1, 1972
4.006
+0.053
1.33%
jan 1, 1973
4.037
+0.03
0.76%
jan 1, 1974
4.067
+0.03
0.75%
jan 1, 1975
4.086
+0.018
0.45%
jan 1, 1976
4.097
+0.011
0.28%
jan 1, 1977
4.099
+0.002
0.05%
jan 1, 1978
4.101
+0.002
0.06%
jan 1, 1979
4.117
+0.015
0.37%
jan 1, 1980
4.15
+0.033
0.8%
jan 1, 1981
4.189
+0.039
0.95%
jan 1, 1982
4.188
-0.001
-0.03%
jan 1, 1983
4.162
-0.026
-0.61%
jan 1, 1984
4.168
+0.006
0.14%
jan 1, 1985
4.135
-0.033
-0.8%
jan 1, 1986
3.713
-0.422
-10.21%
jan 1, 1987
3.834
+0.122
3.28%
jan 1, 1988
3.882
+0.048
1.24%
jan 1, 1989
3.637
-0.244
-6.29%
jan 1, 1990
3.053
-0.584
-16.06%
jan 1, 1991
2.278
-0.775
-25.39%
jan 1, 1992
1.479
-0.799
-35.08%
jan 1, 1993
0.849
-0.629
-42.56%
jan 1, 1994
0.606
-0.243
-28.61%
jan 1, 1995
0.871
+0.264
43.56%
jan 1, 1996
1.541
+0.671
77.05%
jan 1, 1997
2.298
+0.757
49.09%
jan 1, 1998
2.931
+0.633
27.56%
jan 1, 1999
3.522
+0.591
20.14%
jan 1, 2000
3.986
+0.465
13.19%
jan 1, 2001
4.331
+0.345
8.65%
jan 1, 2002
4.697
+0.366
8.45%
jan 1, 2003
5.0
+0.302
6.43%
jan 1, 2004
5.089
+0.089
1.78%
jan 1, 2005
4.934
-0.154
-3.04%
jan 1, 2006
4.629
-0.305
-6.19%
jan 1, 2007
4.276
-0.352
-7.61%
jan 1, 2008
4.002
-0.274
-6.41%
jan 1, 2009
3.825
-0.177
-4.42%
jan 1, 2010
3.801
-0.025
-0.64%
jan 1, 2011
3.866
+0.065
1.71%
jan 1, 2012
3.948
+0.082
2.12%
Ranking of countries by current statistics by years


Comments: