29
/
en
AIzaSyAYiBZKx7MnpbEhh9jyipgxe19OcubqV5w
April 1, 2024
198661
Monaco
MCO
true
2
1
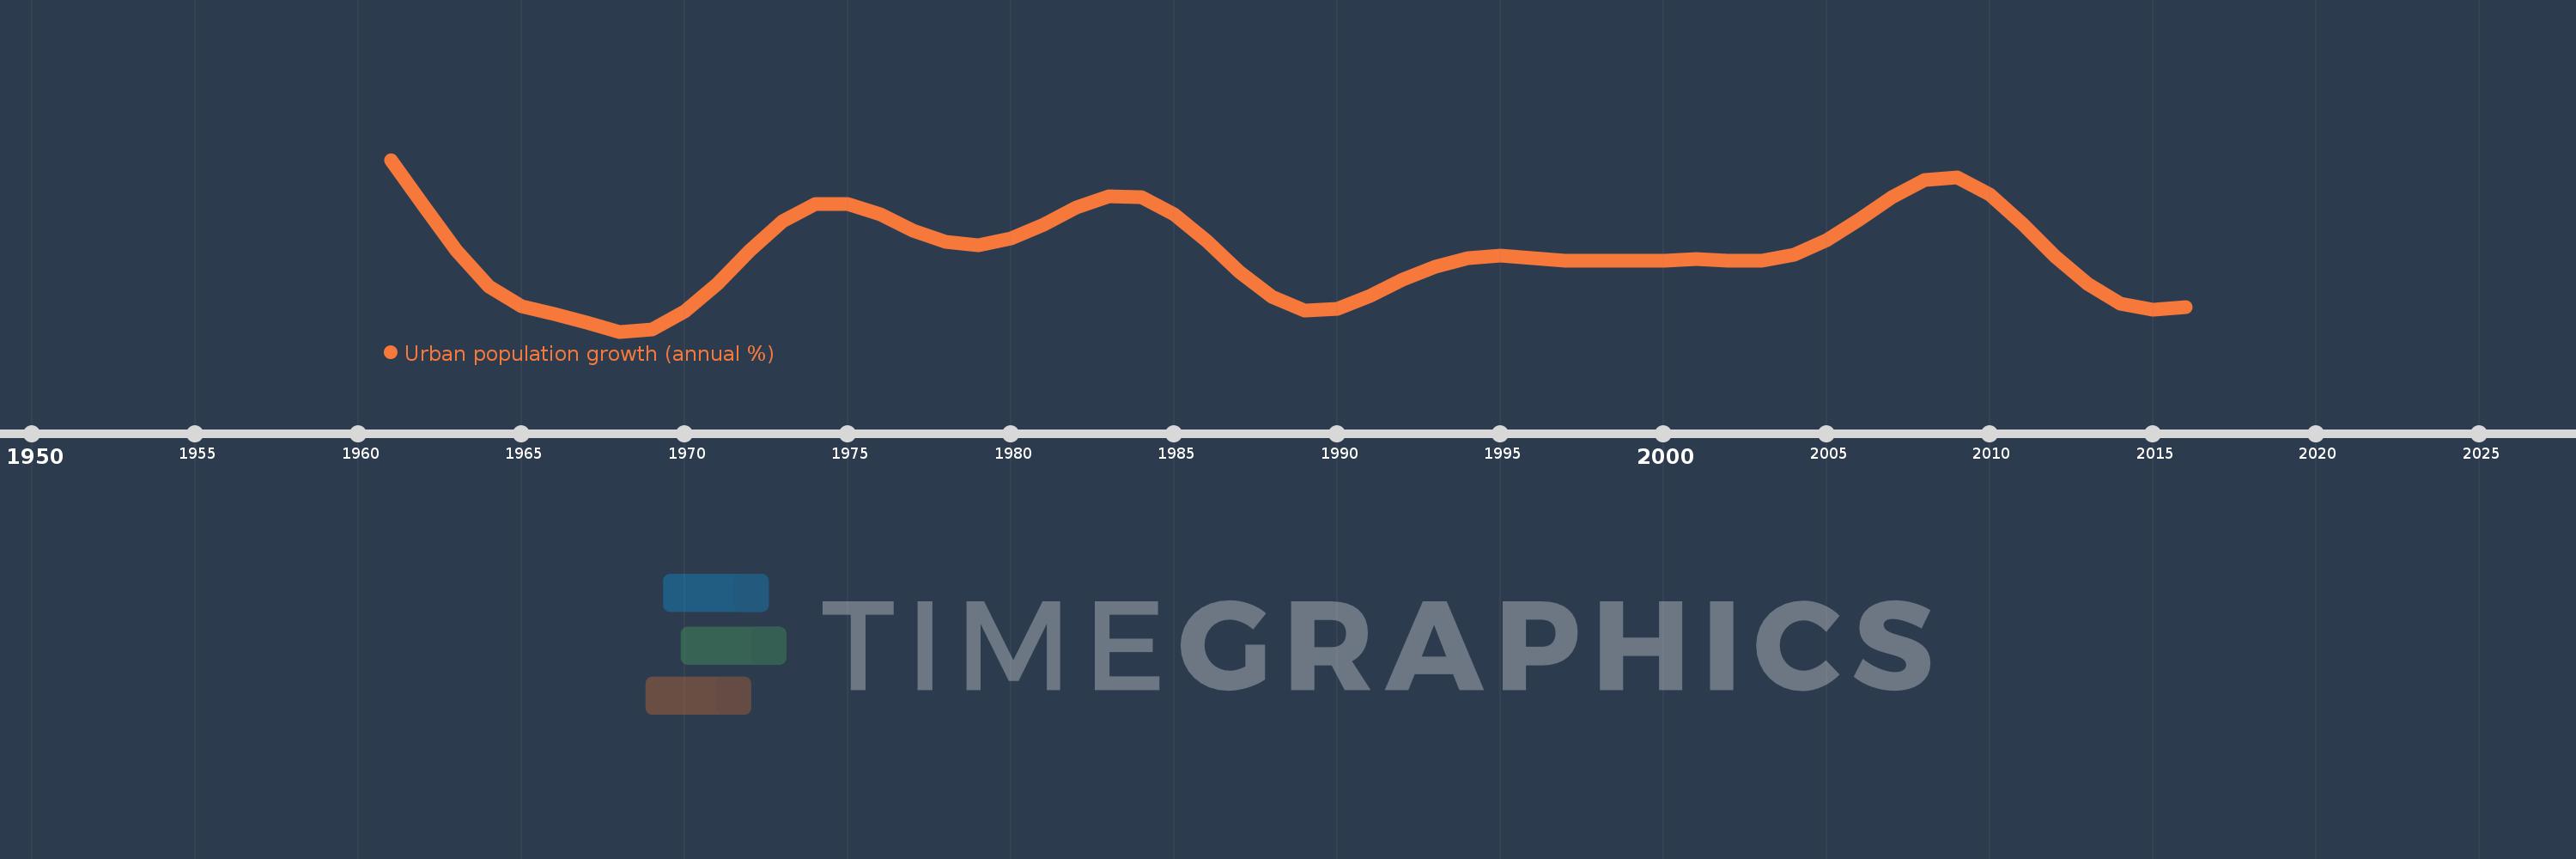
Urban population growth (annual %)
2016,2015,2014,2013,2012,2011,2010,2009,2008,2007,2006,2005,2004,2003,2002,2001,2000,1999,1998,1997,1996,1995,1994,1993,1992,1991,1990,1989,1988,1987,1986,1985,1984,1983,1982,1981,1980,1979,1978,1977,1976,1975,1974,1973,1972,1971,1970,1969,1968,1967,1966,1965,1964,1963,1962,1961
This statistics in other country:
AfghanistanAlbaniaAlgeriaAmerican SamoaAndorraAngolaAntigua and BarbudaArab WorldArgentinaArmeniaArubaAustraliaAustriaAzerbaijanBahamas, TheBahrainBangladeshBarbadosBelarusBelgiumBelizeBeninBermudaBhutanBoliviaBosnia and HerzegovinaBotswanaBrazilBritish Virgin IslandsBrunei DarussalamBulgariaBurkina FasoBurundiCabo VerdeCambodiaCameroonCanadaCaribbean small statesCayman IslandsCentral African RepublicCentral Europe and the BalticsChadChannel IslandsChileChinaColombiaComorosCongo, Dem. Rep.Congo, Rep.Costa RicaCote d'IvoireCroatiaCubaCuracaoCyprusCzech RepublicDenmarkDjiboutiDominicaDominican RepublicEarly-demographic dividendEast Asia & PacificEast Asia & Pacific (excluding high income)East Asia & Pacific (IDA & IBRD countries)EcuadorEgypt, Arab Rep.El SalvadorEquatorial GuineaEritreaEstoniaEthiopiaEuro areaEurope & Central AsiaEurope & Central Asia (excluding high income)Europe & Central Asia (IDA & IBRD countries)European UnionFaroe IslandsFijiFinlandFragile and conflict affected situationsFranceFrench PolynesiaGabonGambia, TheGeorgiaGermanyGhanaGibraltarGreeceGreenlandGrenadaGuamGuatemalaGuineaGuinea-BissauGuyanaHaitiHeavily indebted poor countries (HIPC)High incomeHondurasHong Kong SAR, ChinaHungaryIBRD onlyIcelandIDA & IBRD totalIDA blendIDA onlyIDA totalIndiaIndonesiaIran, Islamic Rep.IraqIrelandIsle of ManIsraelItalyJamaicaJapanJordanKazakhstanKenyaKiribatiKorea, Dem. People’s Rep.Korea, Rep.KuwaitKyrgyz RepublicLao PDRLate-demographic dividendLatin America & Caribbean Latin America & Caribbean (excluding high income)Latin America & the Caribbean (IDA & IBRD countries)LatviaLeast developed countries: UN classificationLebanonLesothoLiberiaLibyaLiechtensteinLithuaniaLow & middle incomeLow incomeLower middle incomeLuxembourgMacao SAR, ChinaMacedonia, FYRMadagascarMalawiMalaysiaMaldivesMaliMaltaMarshall IslandsMauritaniaMauritiusMexicoMicronesia, Fed. Sts.Middle East & North AfricaMiddle East & North Africa (excluding high income)Middle East & North Africa (IDA & IBRD countries)Middle incomeMoldovaMonacoMongoliaMontenegroMoroccoMozambiqueMyanmarNamibiaNauruNepalNetherlandsNew CaledoniaNew ZealandNicaraguaNigerNigeriaNorth AmericaNorthern Mariana IslandsNorwayOECD membersOmanOther small statesPacific island small statesPakistanPalauPanamaPapua New GuineaParaguayPeruPhilippinesPolandPortugalPost-demographic dividendPre-demographic dividendPuerto RicoQatarRomaniaRussian FederationRwandaSamoaSan MarinoSao Tome and PrincipeSaudi ArabiaSenegalSerbiaSeychellesSierra LeoneSingaporeSint Maarten (Dutch part)Slovak RepublicSloveniaSmall statesSolomon IslandsSomaliaSouth AfricaSouth AsiaSouth Asia (IDA & IBRD)South SudanSpainSri LankaSt. Kitts and NevisSt. LuciaSt. Vincent and the GrenadinesSub-Saharan Africa Sub-Saharan Africa (excluding high income)Sub-Saharan Africa (IDA & IBRD countries)SudanSurinameSwazilandSwedenSwitzerlandSyrian Arab RepublicTajikistanTanzaniaThailandTimor-LesteTogoTongaTrinidad and TobagoTunisiaTurkeyTurkmenistanTurks and Caicos IslandsTuvaluUgandaUkraineUnited Arab EmiratesUnited KingdomUnited StatesUpper middle incomeUruguayUzbekistanVanuatuVenezuela, RBVietnamVirgin Islands (U.S.)West Bank and GazaWorldYemen, Rep.ZambiaZimbabwe Timeline:
This timeline shows a graph from 1961 to 2016 of Monaco. No data until 1960. Number of actual observations by date: 56.
Source name:
World Development Indicators
Source organization:
World Bank Staff estimates based on United Nations, World Urbanization Prospects.
Categories, topics:
Climate Change, Urban Development
Last updated:
apr 23, 2017
Indicators value changes by year
At the date of observation
Value
Absolute change
Change from previous value
jan 1, 1961
2.165
+2.165
0.0%
jan 1, 1962
1.582
-0.584
-26.95%
jan 1, 1963
1.003
-0.579
-36.58%
jan 1, 1964
0.55
-0.454
-45.21%
jan 1, 1965
0.293
-0.257
-46.68%
jan 1, 1966
0.198
-0.095
-32.52%
jan 1, 1967
0.09
-0.108
-54.41%
jan 1, 1968
-0.03
-0.12
-133.32%
jan 1, 1969
-0.004
+0.026
-85.71%
jan 1, 1970
0.223
+0.227
-5.29K%
jan 1, 1971
0.581
+0.358
160.49%
jan 1, 1972
1.008
+0.428
73.61%
jan 1, 1973
1.382
+0.373
37.01%
jan 1, 1974
1.6
+0.219
15.84%
jan 1, 1975
1.603
+0.003
0.19%
jan 1, 1976
1.463
-0.14
-8.75%
jan 1, 1977
1.262
-0.201
-13.75%
jan 1, 1978
1.122
-0.14
-11.07%
jan 1, 1979
1.068
-0.055
-4.87%
jan 1, 1980
1.162
+0.095
8.89%
jan 1, 1981
1.336
+0.174
14.95%
jan 1, 1982
1.554
+0.218
16.33%
jan 1, 1983
1.694
+0.139
8.96%
jan 1, 1984
1.683
-0.01
-0.61%
jan 1, 1985
1.47
-0.214
-12.69%
jan 1, 1986
1.123
-0.347
-23.59%
jan 1, 1987
0.733
-0.39
-34.77%
jan 1, 1988
0.416
-0.317
-43.25%
jan 1, 1989
0.236
-0.179
-43.16%
jan 1, 1990
0.256
+0.02
8.43%
jan 1, 1991
0.426
+0.169
66.1%
jan 1, 1992
0.637
+0.211
49.6%
jan 1, 1993
0.8
+0.164
25.69%
jan 1, 1994
0.913
+0.113
14.14%
jan 1, 1995
0.941
+0.028
3.05%
jan 1, 1996
0.906
-0.035
-3.7%
jan 1, 1997
0.879
-0.028
-3.04%
jan 1, 1998
0.871
-0.008
-0.87%
jan 1, 1999
0.876
+0.005
0.59%
jan 1, 2000
0.878
+0.002
0.21%
jan 1, 2001
0.895
+0.017
1.97%
jan 1, 2002
0.878
-0.017
-1.92%
jan 1, 2003
0.874
-0.005
-0.52%
jan 1, 2004
0.951
+0.077
8.86%
jan 1, 2005
1.143
+0.192
20.21%
jan 1, 2006
1.397
+0.254
22.18%
jan 1, 2007
1.689
+0.292
20.93%
jan 1, 2008
1.907
+0.218
12.88%
jan 1, 2009
1.936
+0.029
1.51%
jan 1, 2010
1.72
-0.215
-11.13%
jan 1, 2011
1.35
-0.37
-21.54%
jan 1, 2012
0.929
-0.421
-31.15%
jan 1, 2013
0.576
-0.353
-37.97%
jan 1, 2014
0.331
-0.245
-42.59%
jan 1, 2015
0.253
-0.078
-23.61%
jan 1, 2016
0.287
+0.034
13.38%
Ranking of countries by current statistics by years


Comments: