29
/
en
AIzaSyAYiBZKx7MnpbEhh9jyipgxe19OcubqV5w
April 1, 2024
158112
Iran, Islamic Rep.
IRN
true
2
1
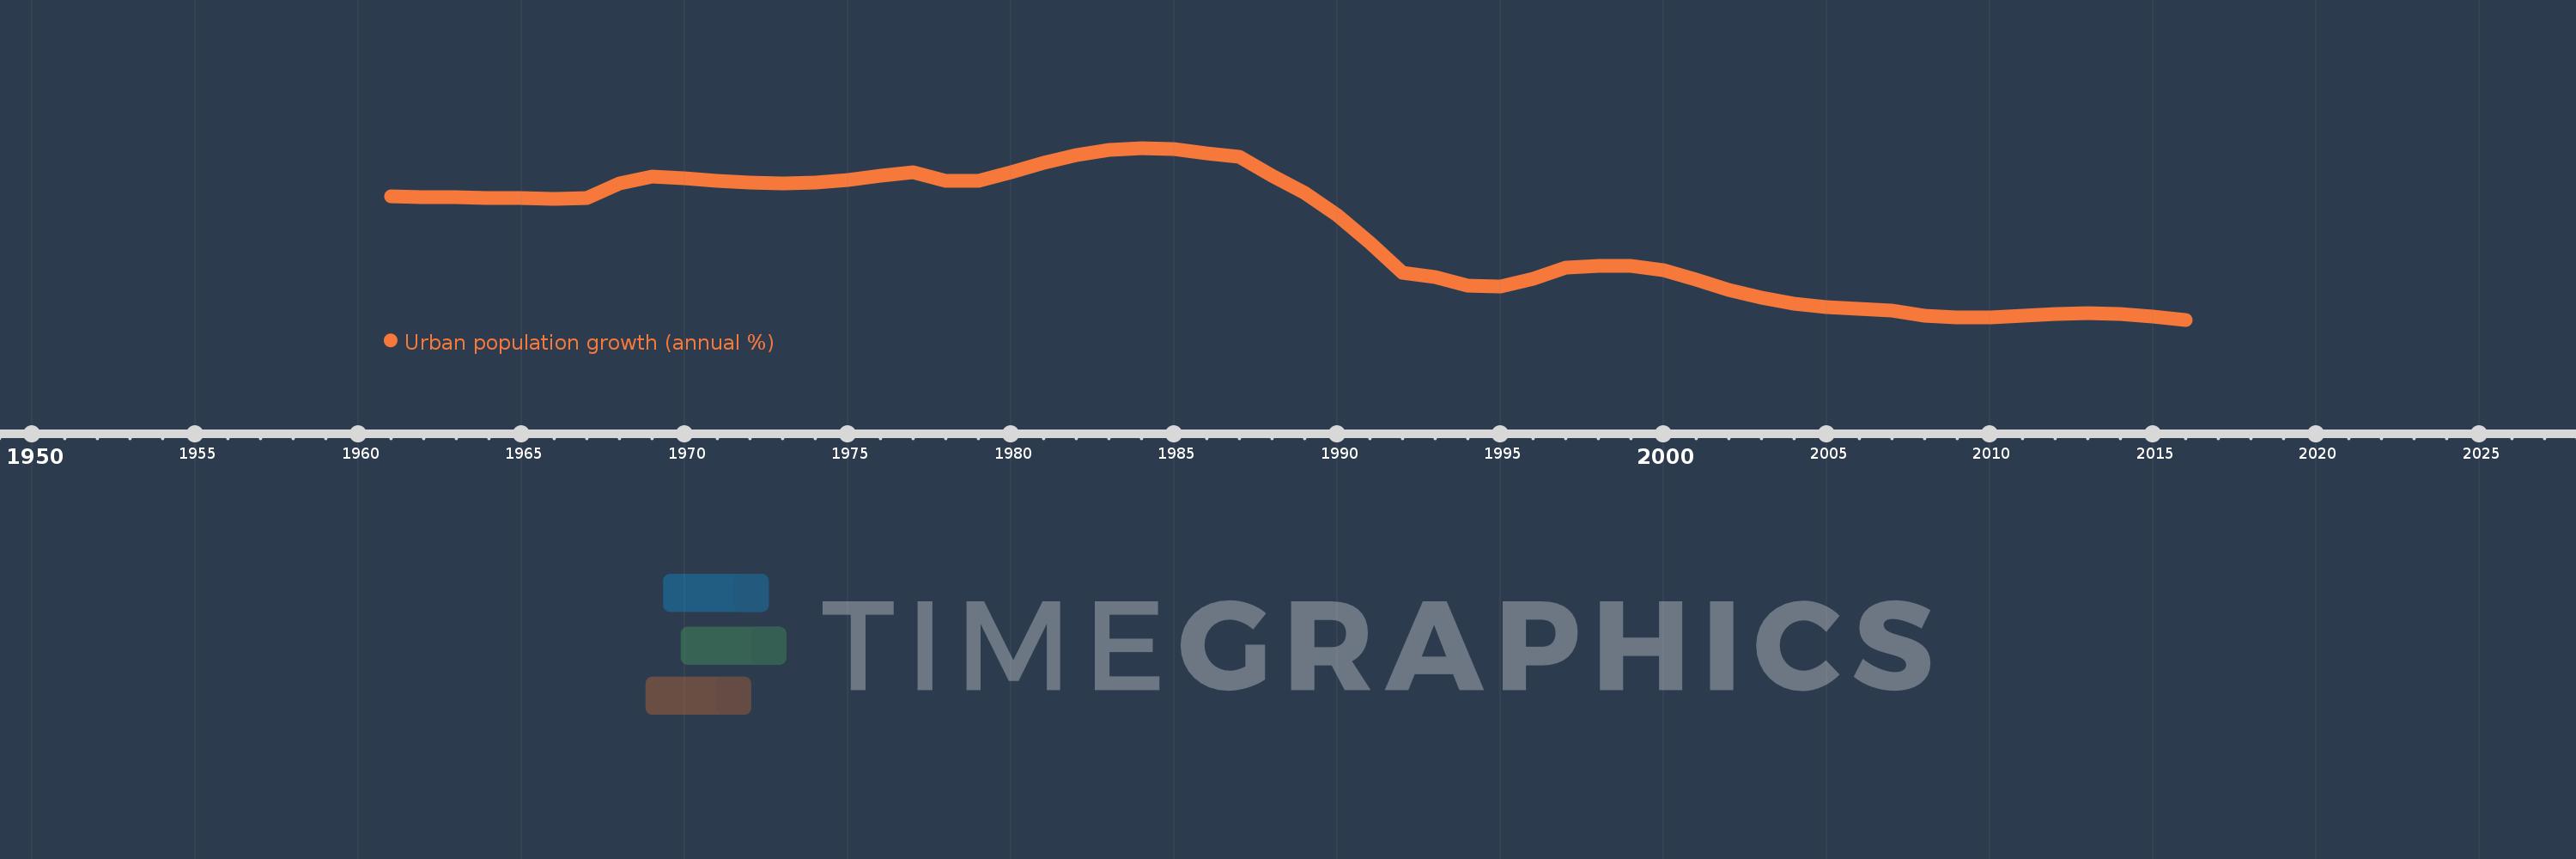
Urban population growth (annual %)
2016,2015,2014,2013,2012,2011,2010,2009,2008,2007,2006,2005,2004,2003,2002,2001,2000,1999,1998,1997,1996,1995,1994,1993,1992,1991,1990,1989,1988,1987,1986,1985,1984,1983,1982,1981,1980,1979,1978,1977,1976,1975,1974,1973,1972,1971,1970,1969,1968,1967,1966,1965,1964,1963,1962,1961
This statistics in other country:
AfghanistanAlbaniaAlgeriaAmerican SamoaAndorraAngolaAntigua and BarbudaArab WorldArgentinaArmeniaArubaAustraliaAustriaAzerbaijanBahamas, TheBahrainBangladeshBarbadosBelarusBelgiumBelizeBeninBermudaBhutanBoliviaBosnia and HerzegovinaBotswanaBrazilBritish Virgin IslandsBrunei DarussalamBulgariaBurkina FasoBurundiCabo VerdeCambodiaCameroonCanadaCaribbean small statesCayman IslandsCentral African RepublicCentral Europe and the BalticsChadChannel IslandsChileChinaColombiaComorosCongo, Dem. Rep.Congo, Rep.Costa RicaCote d'IvoireCroatiaCubaCuracaoCyprusCzech RepublicDenmarkDjiboutiDominicaDominican RepublicEarly-demographic dividendEast Asia & PacificEast Asia & Pacific (excluding high income)East Asia & Pacific (IDA & IBRD countries)EcuadorEgypt, Arab Rep.El SalvadorEquatorial GuineaEritreaEstoniaEthiopiaEuro areaEurope & Central AsiaEurope & Central Asia (excluding high income)Europe & Central Asia (IDA & IBRD countries)European UnionFaroe IslandsFijiFinlandFragile and conflict affected situationsFranceFrench PolynesiaGabonGambia, TheGeorgiaGermanyGhanaGibraltarGreeceGreenlandGrenadaGuamGuatemalaGuineaGuinea-BissauGuyanaHaitiHeavily indebted poor countries (HIPC)High incomeHondurasHong Kong SAR, ChinaHungaryIBRD onlyIcelandIDA & IBRD totalIDA blendIDA onlyIDA totalIndiaIndonesiaIran, Islamic Rep.IraqIrelandIsle of ManIsraelItalyJamaicaJapanJordanKazakhstanKenyaKiribatiKorea, Dem. People’s Rep.Korea, Rep.KuwaitKyrgyz RepublicLao PDRLate-demographic dividendLatin America & Caribbean Latin America & Caribbean (excluding high income)Latin America & the Caribbean (IDA & IBRD countries)LatviaLeast developed countries: UN classificationLebanonLesothoLiberiaLibyaLiechtensteinLithuaniaLow & middle incomeLow incomeLower middle incomeLuxembourgMacao SAR, ChinaMacedonia, FYRMadagascarMalawiMalaysiaMaldivesMaliMaltaMarshall IslandsMauritaniaMauritiusMexicoMicronesia, Fed. Sts.Middle East & North AfricaMiddle East & North Africa (excluding high income)Middle East & North Africa (IDA & IBRD countries)Middle incomeMoldovaMonacoMongoliaMontenegroMoroccoMozambiqueMyanmarNamibiaNauruNepalNetherlandsNew CaledoniaNew ZealandNicaraguaNigerNigeriaNorth AmericaNorthern Mariana IslandsNorwayOECD membersOmanOther small statesPacific island small statesPakistanPalauPanamaPapua New GuineaParaguayPeruPhilippinesPolandPortugalPost-demographic dividendPre-demographic dividendPuerto RicoQatarRomaniaRussian FederationRwandaSamoaSan MarinoSao Tome and PrincipeSaudi ArabiaSenegalSerbiaSeychellesSierra LeoneSingaporeSint Maarten (Dutch part)Slovak RepublicSloveniaSmall statesSolomon IslandsSomaliaSouth AfricaSouth AsiaSouth Asia (IDA & IBRD)South SudanSpainSri LankaSt. Kitts and NevisSt. LuciaSt. Vincent and the GrenadinesSub-Saharan Africa Sub-Saharan Africa (excluding high income)Sub-Saharan Africa (IDA & IBRD countries)SudanSurinameSwazilandSwedenSwitzerlandSyrian Arab RepublicTajikistanTanzaniaThailandTimor-LesteTogoTongaTrinidad and TobagoTunisiaTurkeyTurkmenistanTurks and Caicos IslandsTuvaluUgandaUkraineUnited Arab EmiratesUnited KingdomUnited StatesUpper middle incomeUruguayUzbekistanVanuatuVenezuela, RBVietnamVirgin Islands (U.S.)West Bank and GazaWorldYemen, Rep.ZambiaZimbabwe Timeline:
This timeline shows a graph from 1961 to 2016 of Iran, Islamic Rep.. No data until 1960. Number of actual observations by date: 56.
Source name:
World Development Indicators
Source organization:
World Bank Staff estimates based on United Nations, World Urbanization Prospects.
Categories, topics:
Climate Change, Urban Development
Last updated:
apr 23, 2017
Indicators value changes by year
At the date of observation
Value
Absolute change
Change from previous value
jan 1, 1961
4.518
+4.518
0.0%
jan 1, 1962
4.504
-0.014
-0.3%
jan 1, 1963
4.502
-0.003
-0.06%
jan 1, 1964
4.49
-0.011
-0.25%
jan 1, 1965
4.483
-0.008
-0.17%
jan 1, 1966
4.47
-0.012
-0.28%
jan 1, 1967
4.476
+0.006
0.13%
jan 1, 1968
4.78
+0.304
6.8%
jan 1, 1969
4.937
+0.156
3.27%
jan 1, 1970
4.89
-0.047
-0.95%
jan 1, 1971
4.847
-0.043
-0.88%
jan 1, 1972
4.81
-0.036
-0.75%
jan 1, 1973
4.795
-0.015
-0.31%
jan 1, 1974
4.806
+0.011
0.22%
jan 1, 1975
4.867
+0.061
1.27%
jan 1, 1976
4.952
+0.085
1.75%
jan 1, 1977
5.024
+0.072
1.45%
jan 1, 1978
4.845
-0.179
-3.57%
jan 1, 1979
4.834
-0.011
-0.22%
jan 1, 1980
5.019
+0.185
3.83%
jan 1, 1981
5.223
+0.204
4.06%
jan 1, 1982
5.388
+0.165
3.15%
jan 1, 1983
5.488
+0.1
1.86%
jan 1, 1984
5.529
+0.041
0.74%
jan 1, 1985
5.503
-0.026
-0.47%
jan 1, 1986
5.408
-0.094
-1.71%
jan 1, 1987
5.342
-0.066
-1.23%
jan 1, 1988
4.953
-0.389
-7.28%
jan 1, 1989
4.599
-0.354
-7.15%
jan 1, 1990
4.121
-0.478
-10.39%
jan 1, 1991
3.542
-0.579
-14.04%
jan 1, 1992
2.918
-0.625
-17.63%
jan 1, 1993
2.835
-0.082
-2.82%
jan 1, 1994
2.657
-0.178
-6.29%
jan 1, 1995
2.626
-0.031
-1.16%
jan 1, 1996
2.796
+0.17
6.46%
jan 1, 1997
3.028
+0.232
8.3%
jan 1, 1998
3.056
+0.028
0.93%
jan 1, 1999
3.07
+0.014
0.45%
jan 1, 2000
2.973
-0.096
-3.14%
jan 1, 2001
2.775
-0.199
-6.68%
jan 1, 2002
2.563
-0.212
-7.63%
jan 1, 2003
2.405
-0.158
-6.18%
jan 1, 2004
2.281
-0.123
-5.13%
jan 1, 2005
2.208
-0.073
-3.2%
jan 1, 2006
2.173
-0.036
-1.61%
jan 1, 2007
2.139
-0.034
-1.56%
jan 1, 2008
2.03
-0.109
-5.08%
jan 1, 2009
1.982
-0.048
-2.39%
jan 1, 2010
1.993
+0.012
0.59%
jan 1, 2011
2.022
+0.028
1.41%
jan 1, 2012
2.055
+0.034
1.68%
jan 1, 2013
2.081
+0.026
1.26%
jan 1, 2014
2.063
-0.018
-0.86%
jan 1, 2015
2.014
-0.05
-2.42%
jan 1, 2016
1.939
-0.074
-3.69%
Ranking of countries by current statistics by years


Comments: