29
/
en
AIzaSyAYiBZKx7MnpbEhh9jyipgxe19OcubqV5w
April 1, 2024
125688
Egypt, Arab Rep.
EGY
true
2
1
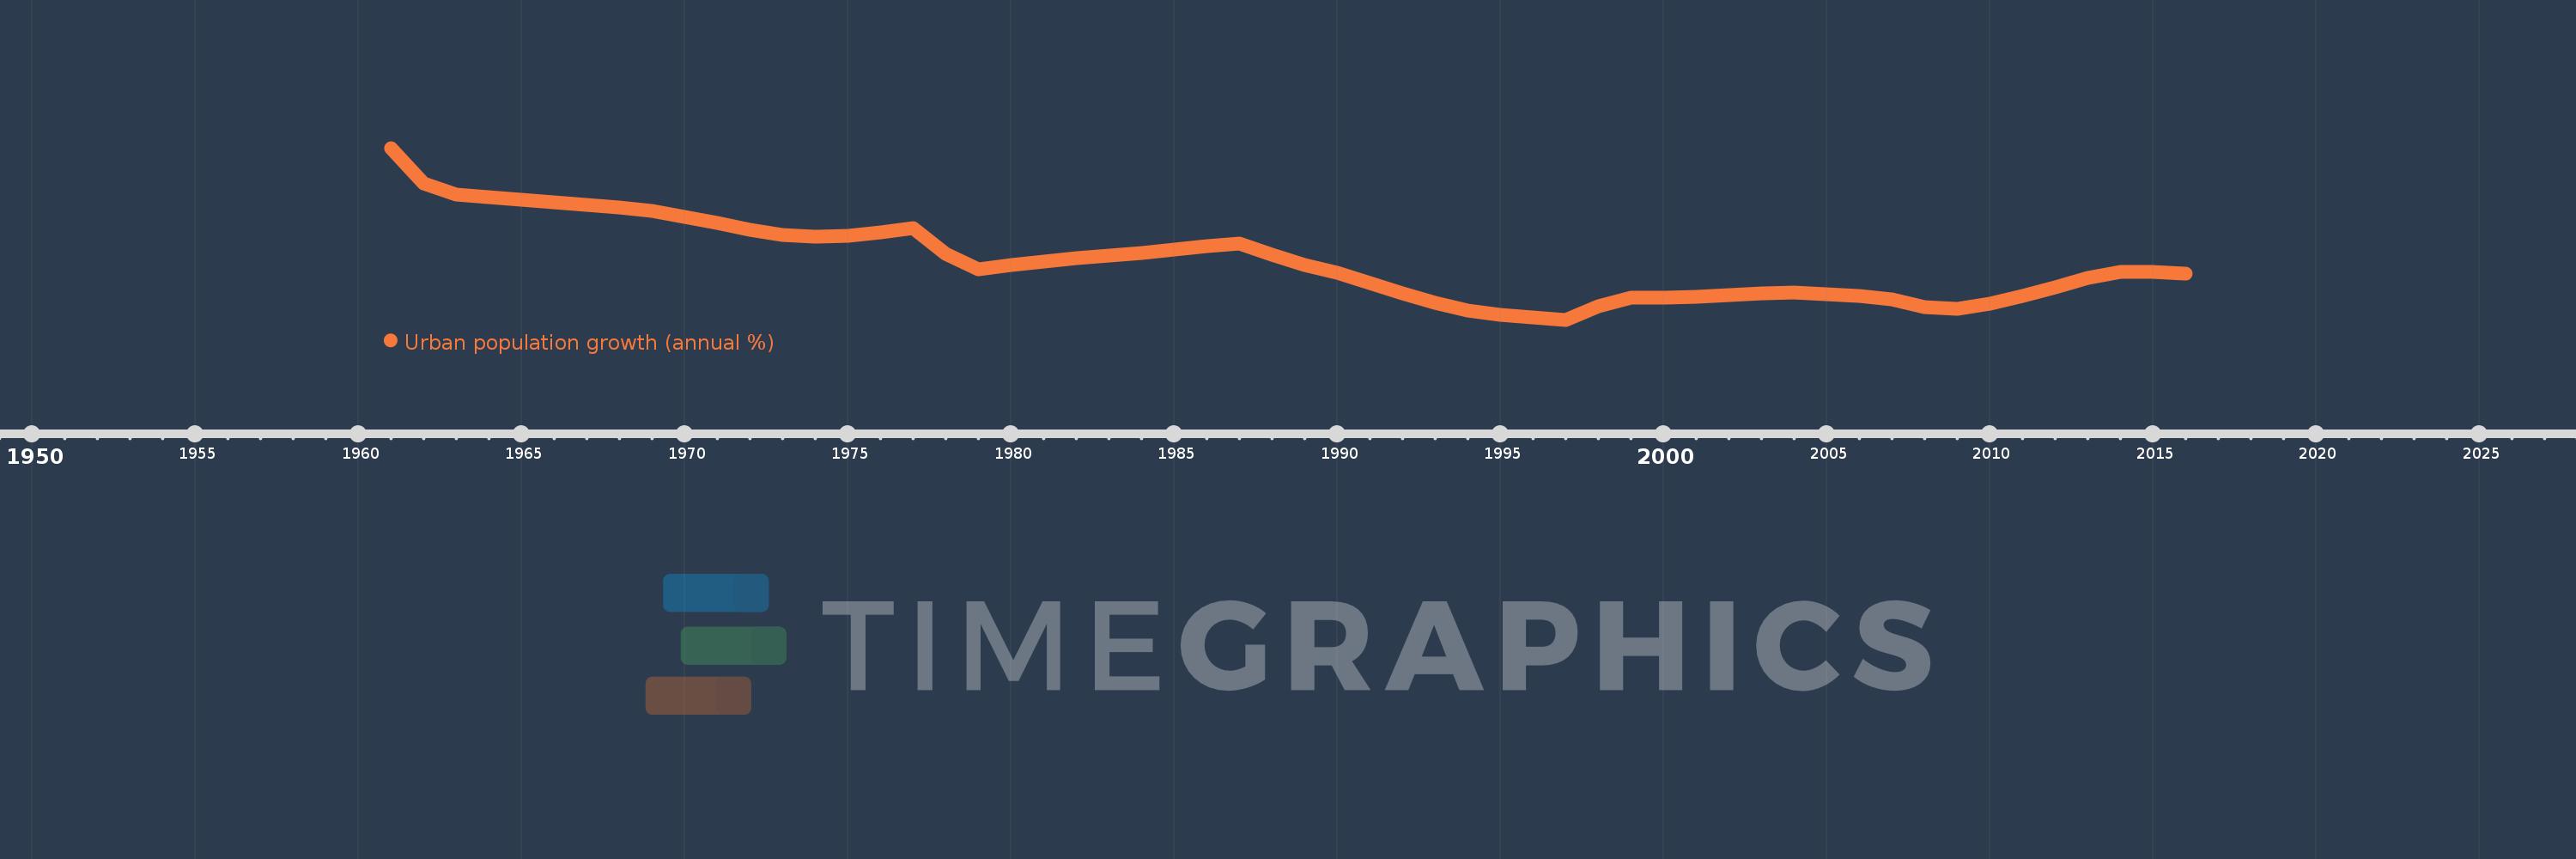
Urban population growth (annual %)
2016,2015,2014,2013,2012,2011,2010,2009,2008,2007,2006,2005,2004,2003,2002,2001,2000,1999,1998,1997,1996,1995,1994,1993,1992,1991,1990,1989,1988,1987,1986,1985,1984,1983,1982,1981,1980,1979,1978,1977,1976,1975,1974,1973,1972,1971,1970,1969,1968,1967,1966,1965,1964,1963,1962,1961
This statistics in other country:
AfghanistanAlbaniaAlgeriaAmerican SamoaAndorraAngolaAntigua and BarbudaArab WorldArgentinaArmeniaArubaAustraliaAustriaAzerbaijanBahamas, TheBahrainBangladeshBarbadosBelarusBelgiumBelizeBeninBermudaBhutanBoliviaBosnia and HerzegovinaBotswanaBrazilBritish Virgin IslandsBrunei DarussalamBulgariaBurkina FasoBurundiCabo VerdeCambodiaCameroonCanadaCaribbean small statesCayman IslandsCentral African RepublicCentral Europe and the BalticsChadChannel IslandsChileChinaColombiaComorosCongo, Dem. Rep.Congo, Rep.Costa RicaCote d'IvoireCroatiaCubaCuracaoCyprusCzech RepublicDenmarkDjiboutiDominicaDominican RepublicEarly-demographic dividendEast Asia & PacificEast Asia & Pacific (excluding high income)East Asia & Pacific (IDA & IBRD countries)EcuadorEgypt, Arab Rep.El SalvadorEquatorial GuineaEritreaEstoniaEthiopiaEuro areaEurope & Central AsiaEurope & Central Asia (excluding high income)Europe & Central Asia (IDA & IBRD countries)European UnionFaroe IslandsFijiFinlandFragile and conflict affected situationsFranceFrench PolynesiaGabonGambia, TheGeorgiaGermanyGhanaGibraltarGreeceGreenlandGrenadaGuamGuatemalaGuineaGuinea-BissauGuyanaHaitiHeavily indebted poor countries (HIPC)High incomeHondurasHong Kong SAR, ChinaHungaryIBRD onlyIcelandIDA & IBRD totalIDA blendIDA onlyIDA totalIndiaIndonesiaIran, Islamic Rep.IraqIrelandIsle of ManIsraelItalyJamaicaJapanJordanKazakhstanKenyaKiribatiKorea, Dem. People’s Rep.Korea, Rep.KuwaitKyrgyz RepublicLao PDRLate-demographic dividendLatin America & Caribbean Latin America & Caribbean (excluding high income)Latin America & the Caribbean (IDA & IBRD countries)LatviaLeast developed countries: UN classificationLebanonLesothoLiberiaLibyaLiechtensteinLithuaniaLow & middle incomeLow incomeLower middle incomeLuxembourgMacao SAR, ChinaMacedonia, FYRMadagascarMalawiMalaysiaMaldivesMaliMaltaMarshall IslandsMauritaniaMauritiusMexicoMicronesia, Fed. Sts.Middle East & North AfricaMiddle East & North Africa (excluding high income)Middle East & North Africa (IDA & IBRD countries)Middle incomeMoldovaMonacoMongoliaMontenegroMoroccoMozambiqueMyanmarNamibiaNauruNepalNetherlandsNew CaledoniaNew ZealandNicaraguaNigerNigeriaNorth AmericaNorthern Mariana IslandsNorwayOECD membersOmanOther small statesPacific island small statesPakistanPalauPanamaPapua New GuineaParaguayPeruPhilippinesPolandPortugalPost-demographic dividendPre-demographic dividendPuerto RicoQatarRomaniaRussian FederationRwandaSamoaSan MarinoSao Tome and PrincipeSaudi ArabiaSenegalSerbiaSeychellesSierra LeoneSingaporeSint Maarten (Dutch part)Slovak RepublicSloveniaSmall statesSolomon IslandsSomaliaSouth AfricaSouth AsiaSouth Asia (IDA & IBRD)South SudanSpainSri LankaSt. Kitts and NevisSt. LuciaSt. Vincent and the GrenadinesSub-Saharan Africa Sub-Saharan Africa (excluding high income)Sub-Saharan Africa (IDA & IBRD countries)SudanSurinameSwazilandSwedenSwitzerlandSyrian Arab RepublicTajikistanTanzaniaThailandTimor-LesteTogoTongaTrinidad and TobagoTunisiaTurkeyTurkmenistanTurks and Caicos IslandsTuvaluUgandaUkraineUnited Arab EmiratesUnited KingdomUnited StatesUpper middle incomeUruguayUzbekistanVanuatuVenezuela, RBVietnamVirgin Islands (U.S.)West Bank and GazaWorldYemen, Rep.ZambiaZimbabwe Timeline:
This timeline shows a graph from 1961 to 2016 of Egypt, Arab Rep.. No data until 1960. Number of actual observations by date: 56.
Source name:
World Development Indicators
Source organization:
World Bank Staff estimates based on United Nations, World Urbanization Prospects.
Categories, topics:
Climate Change, Urban Development
Last updated:
apr 23, 2017
Indicators value changes by year
At the date of observation
Value
Absolute change
Change from previous value
jan 1, 1961
4.342
+4.342
0.0%
jan 1, 1962
3.76
-0.582
-13.41%
jan 1, 1963
3.579
-0.181
-4.8%
jan 1, 1964
3.543
-0.037
-1.02%
jan 1, 1965
3.501
-0.042
-1.18%
jan 1, 1966
3.454
-0.047
-1.34%
jan 1, 1967
3.413
-0.041
-1.18%
jan 1, 1968
3.37
-0.044
-1.28%
jan 1, 1969
3.307
-0.063
-1.87%
jan 1, 1970
3.213
-0.094
-2.84%
jan 1, 1971
3.11
-0.103
-3.2%
jan 1, 1972
3.005
-0.105
-3.37%
jan 1, 1973
2.924
-0.081
-2.71%
jan 1, 1974
2.887
-0.037
-1.27%
jan 1, 1975
2.903
+0.016
0.56%
jan 1, 1976
2.963
+0.06
2.06%
jan 1, 1977
3.027
+0.064
2.16%
jan 1, 1978
2.604
-0.423
-13.97%
jan 1, 1979
2.355
-0.249
-9.56%
jan 1, 1980
2.42
+0.065
2.77%
jan 1, 1981
2.482
+0.062
2.56%
jan 1, 1982
2.533
+0.051
2.05%
jan 1, 1983
2.578
+0.045
1.77%
jan 1, 1984
2.627
+0.049
1.89%
jan 1, 1985
2.681
+0.054
2.07%
jan 1, 1986
2.73
+0.049
1.84%
jan 1, 1987
2.782
+0.052
1.9%
jan 1, 1988
2.595
-0.187
-6.71%
jan 1, 1989
2.426
-0.169
-6.51%
jan 1, 1990
2.306
-0.12
-4.94%
jan 1, 1991
2.138
-0.168
-7.29%
jan 1, 1992
1.96
-0.178
-8.34%
jan 1, 1993
1.806
-0.154
-7.84%
jan 1, 1994
1.685
-0.121
-6.69%
jan 1, 1995
1.61
-0.076
-4.49%
jan 1, 1996
1.57
-0.039
-2.44%
jan 1, 1997
1.532
-0.039
-2.47%
jan 1, 1998
1.752
+0.221
14.4%
jan 1, 1999
1.896
+0.143
8.19%
jan 1, 2000
1.897
+0.002
0.08%
jan 1, 2001
1.914
+0.017
0.91%
jan 1, 2002
1.942
+0.027
1.43%
jan 1, 2003
1.97
+0.029
1.47%
jan 1, 2004
1.978
+0.008
0.38%
jan 1, 2005
1.956
-0.022
-1.09%
jan 1, 2006
1.919
-0.037
-1.89%
jan 1, 2007
1.869
-0.051
-2.63%
jan 1, 2008
1.742
-0.127
-6.81%
jan 1, 2009
1.705
-0.037
-2.13%
jan 1, 2010
1.796
+0.091
5.34%
jan 1, 2011
1.921
+0.126
7.0%
jan 1, 2012
2.062
+0.141
7.35%
jan 1, 2013
2.216
+0.153
7.43%
jan 1, 2014
2.308
+0.092
4.15%
jan 1, 2015
2.321
+0.013
0.58%
jan 1, 2016
2.283
-0.038
-1.64%
Ranking of countries by current statistics by years


Comments: