29
/
en
AIzaSyAYiBZKx7MnpbEhh9jyipgxe19OcubqV5w
April 1, 2024
250419
St. Kitts and Nevis
KNA
true
2
1
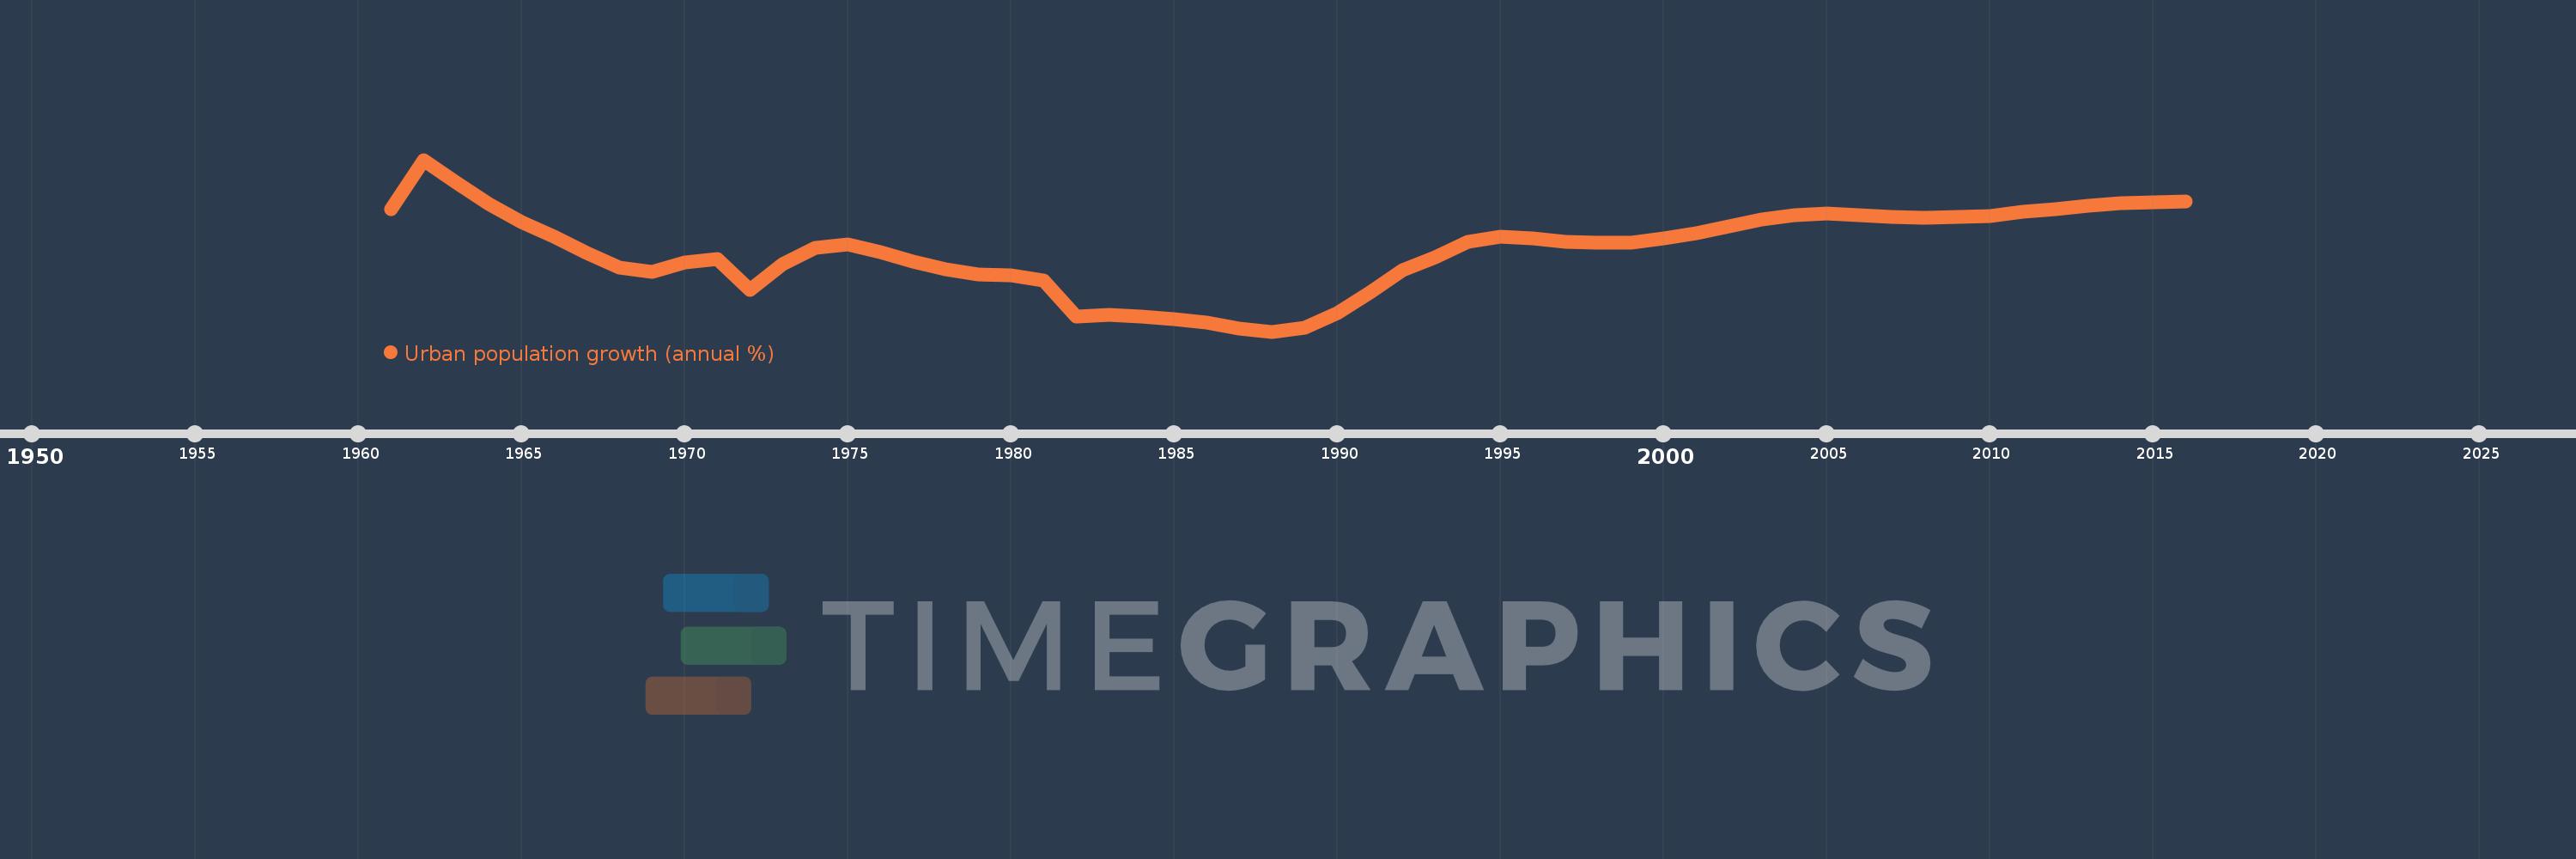
Urban population growth (annual %)
2016,2015,2014,2013,2012,2011,2010,2009,2008,2007,2006,2005,2004,2003,2002,2001,2000,1999,1998,1997,1996,1995,1994,1993,1992,1991,1990,1989,1988,1987,1986,1985,1984,1983,1982,1981,1980,1979,1978,1977,1976,1975,1974,1973,1972,1971,1970,1969,1968,1967,1966,1965,1964,1963,1962,1961
This statistics in other country:
AfghanistanAlbaniaAlgeriaAmerican SamoaAndorraAngolaAntigua and BarbudaArab WorldArgentinaArmeniaArubaAustraliaAustriaAzerbaijanBahamas, TheBahrainBangladeshBarbadosBelarusBelgiumBelizeBeninBermudaBhutanBoliviaBosnia and HerzegovinaBotswanaBrazilBritish Virgin IslandsBrunei DarussalamBulgariaBurkina FasoBurundiCabo VerdeCambodiaCameroonCanadaCaribbean small statesCayman IslandsCentral African RepublicCentral Europe and the BalticsChadChannel IslandsChileChinaColombiaComorosCongo, Dem. Rep.Congo, Rep.Costa RicaCote d'IvoireCroatiaCubaCuracaoCyprusCzech RepublicDenmarkDjiboutiDominicaDominican RepublicEarly-demographic dividendEast Asia & PacificEast Asia & Pacific (excluding high income)East Asia & Pacific (IDA & IBRD countries)EcuadorEgypt, Arab Rep.El SalvadorEquatorial GuineaEritreaEstoniaEthiopiaEuro areaEurope & Central AsiaEurope & Central Asia (excluding high income)Europe & Central Asia (IDA & IBRD countries)European UnionFaroe IslandsFijiFinlandFragile and conflict affected situationsFranceFrench PolynesiaGabonGambia, TheGeorgiaGermanyGhanaGibraltarGreeceGreenlandGrenadaGuamGuatemalaGuineaGuinea-BissauGuyanaHaitiHeavily indebted poor countries (HIPC)High incomeHondurasHong Kong SAR, ChinaHungaryIBRD onlyIcelandIDA & IBRD totalIDA blendIDA onlyIDA totalIndiaIndonesiaIran, Islamic Rep.IraqIrelandIsle of ManIsraelItalyJamaicaJapanJordanKazakhstanKenyaKiribatiKorea, Dem. People’s Rep.Korea, Rep.KuwaitKyrgyz RepublicLao PDRLate-demographic dividendLatin America & Caribbean Latin America & Caribbean (excluding high income)Latin America & the Caribbean (IDA & IBRD countries)LatviaLeast developed countries: UN classificationLebanonLesothoLiberiaLibyaLiechtensteinLithuaniaLow & middle incomeLow incomeLower middle incomeLuxembourgMacao SAR, ChinaMacedonia, FYRMadagascarMalawiMalaysiaMaldivesMaliMaltaMarshall IslandsMauritaniaMauritiusMexicoMicronesia, Fed. Sts.Middle East & North AfricaMiddle East & North Africa (excluding high income)Middle East & North Africa (IDA & IBRD countries)Middle incomeMoldovaMonacoMongoliaMontenegroMoroccoMozambiqueMyanmarNamibiaNauruNepalNetherlandsNew CaledoniaNew ZealandNicaraguaNigerNigeriaNorth AmericaNorthern Mariana IslandsNorwayOECD membersOmanOther small statesPacific island small statesPakistanPalauPanamaPapua New GuineaParaguayPeruPhilippinesPolandPortugalPost-demographic dividendPre-demographic dividendPuerto RicoQatarRomaniaRussian FederationRwandaSamoaSan MarinoSao Tome and PrincipeSaudi ArabiaSenegalSerbiaSeychellesSierra LeoneSingaporeSint Maarten (Dutch part)Slovak RepublicSloveniaSmall statesSolomon IslandsSomaliaSouth AfricaSouth AsiaSouth Asia (IDA & IBRD)South SudanSpainSri LankaSt. Kitts and NevisSt. LuciaSt. Vincent and the GrenadinesSub-Saharan Africa Sub-Saharan Africa (excluding high income)Sub-Saharan Africa (IDA & IBRD countries)SudanSurinameSwazilandSwedenSwitzerlandSyrian Arab RepublicTajikistanTanzaniaThailandTimor-LesteTogoTongaTrinidad and TobagoTunisiaTurkeyTurkmenistanTurks and Caicos IslandsTuvaluUgandaUkraineUnited Arab EmiratesUnited KingdomUnited StatesUpper middle incomeUruguayUzbekistanVanuatuVenezuela, RBVietnamVirgin Islands (U.S.)West Bank and GazaWorldYemen, Rep.ZambiaZimbabwe Timeline:
This timeline shows a graph from 1961 to 2016 of St. Kitts and Nevis. No data until 1960. Number of actual observations by date: 56.
Source name:
World Development Indicators
Source organization:
World Bank Staff estimates based on United Nations, World Urbanization Prospects.
Categories, topics:
Climate Change, Urban Development
Last updated:
apr 23, 2017
Indicators value changes by year
Minimum:
-1.189
jan 1, 1988
At the date of observation
Value
Absolute change
Change from previous value
jan 1, 1961
1.244
+1.244
0.0%
jan 1, 1962
2.229
+0.985
79.14%
jan 1, 1963
1.774
-0.455
-20.42%
jan 1, 1964
1.342
-0.432
-24.35%
jan 1, 1965
0.993
-0.349
-25.99%
jan 1, 1966
0.694
-0.299
-30.12%
jan 1, 1967
0.381
-0.313
-45.06%
jan 1, 1968
0.085
-0.296
-77.64%
jan 1, 1969
0.0
-0.085
-100.0%
jan 1, 1971
0.255
+0.065
34.18%
jan 1, 1972
-0.36
-0.614
-241.1%
jan 1, 1973
0.151
+0.51
-141.86%
jan 1, 1974
0.483
+0.332
220.72%
jan 1, 1975
0.539
+0.056
11.59%
jan 1, 1976
0.394
-0.145
-26.85%
jan 1, 1977
0.206
-0.188
-47.7%
jan 1, 1978
0.058
-0.148
-71.91%
jan 1, 1979
-0.045
-0.103
-177.77%
jan 1, 1980
-0.077
-0.032
71.53%
jan 1, 1981
-0.18
-0.103
133.63%
jan 1, 1982
-0.888
-0.707
391.9%
jan 1, 1983
-0.863
+0.025
-2.8%
jan 1, 1984
-0.884
-0.021
2.41%
jan 1, 1985
-0.938
-0.055
6.19%
jan 1, 1986
-1.015
-0.076
8.14%
jan 1, 1987
-1.127
-0.113
11.12%
jan 1, 1988
-1.189
-0.061
5.43%
jan 1, 1989
-1.112
+0.077
-6.44%
jan 1, 1990
-0.828
+0.284
-25.53%
jan 1, 1991
-0.417
+0.411
-49.69%
jan 1, 1992
0.035
+0.452
-108.49%
jan 1, 1993
0.297
+0.261
738.61%
jan 1, 1994
0.591
+0.294
99.11%
jan 1, 1995
0.699
+0.108
18.28%
jan 1, 1996
0.673
-0.026
-3.66%
jan 1, 1997
0.6
-0.073
-10.88%
jan 1, 1998
0.576
-0.024
-4.01%
jan 1, 1999
0.579
+0.003
0.61%
jan 1, 2000
0.664
+0.084
14.58%
jan 1, 2001
0.767
+0.103
15.5%
jan 1, 2002
0.9
+0.134
17.44%
jan 1, 2003
1.037
+0.137
15.18%
jan 1, 2004
1.124
+0.087
8.38%
jan 1, 2005
1.156
+0.032
2.89%
jan 1, 2006
1.13
-0.026
-2.24%
jan 1, 2007
1.099
-0.031
-2.78%
jan 1, 2008
1.081
-0.018
-1.65%
jan 1, 2009
1.088
+0.007
0.64%
jan 1, 2010
1.118
+0.031
2.84%
jan 1, 2011
1.19
+0.072
6.41%
jan 1, 2012
1.253
+0.063
5.3%
jan 1, 2013
1.314
+0.061
4.84%
jan 1, 2014
1.36
+0.046
3.54%
jan 1, 2015
1.388
+0.027
2.01%
jan 1, 2016
1.408
+0.02
1.46%
Ranking of countries by current statistics by years


Comments: