29
/
en
AIzaSyAYiBZKx7MnpbEhh9jyipgxe19OcubqV5w
April 1, 2024
130010
Estonia
EST
true
2
1
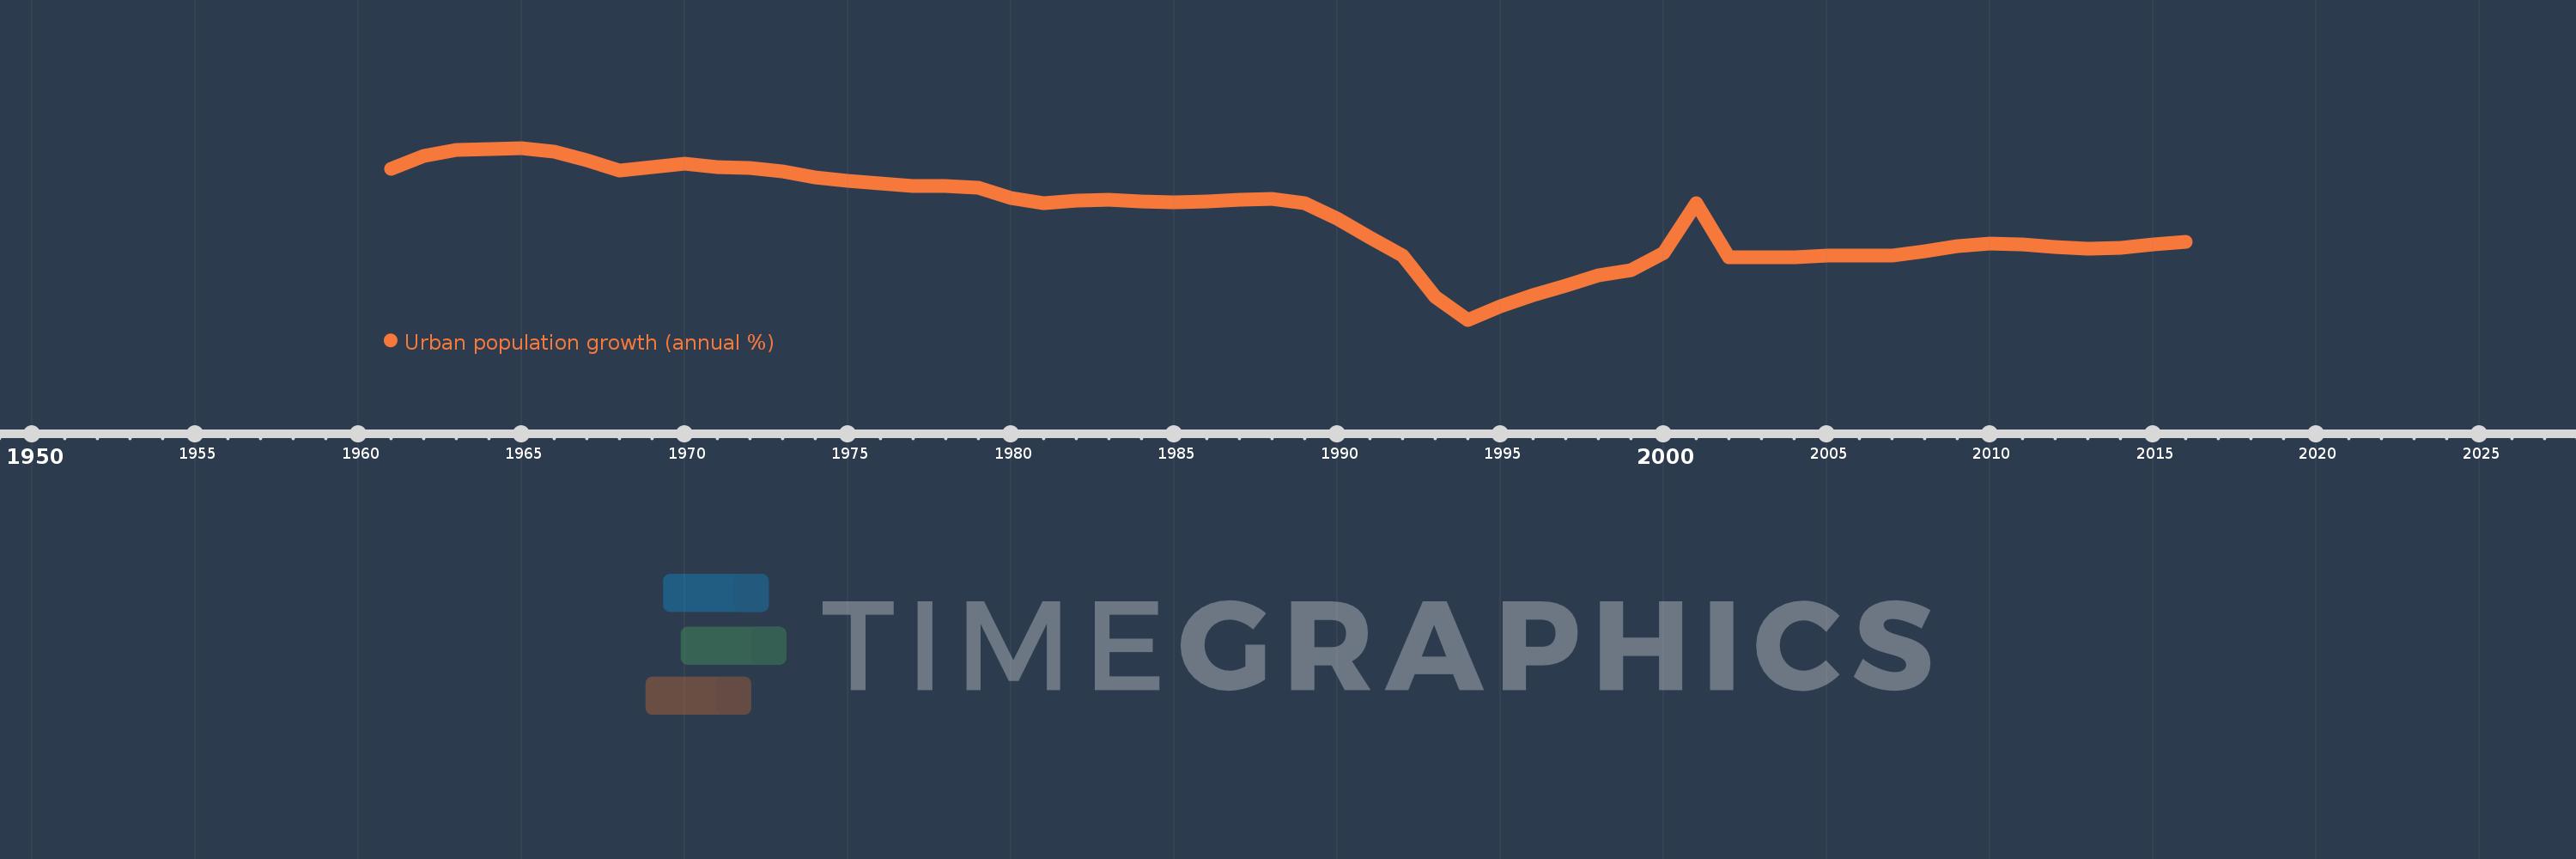
Urban population growth (annual %)
2016,2015,2014,2013,2012,2011,2010,2009,2008,2007,2006,2005,2004,2003,2002,2001,2000,1999,1998,1997,1996,1995,1994,1993,1992,1991,1990,1989,1988,1987,1986,1985,1984,1983,1982,1981,1980,1979,1978,1977,1976,1975,1974,1973,1972,1971,1970,1969,1968,1967,1966,1965,1964,1963,1962,1961
This statistics in other country:
AfghanistanAlbaniaAlgeriaAmerican SamoaAndorraAngolaAntigua and BarbudaArab WorldArgentinaArmeniaArubaAustraliaAustriaAzerbaijanBahamas, TheBahrainBangladeshBarbadosBelarusBelgiumBelizeBeninBermudaBhutanBoliviaBosnia and HerzegovinaBotswanaBrazilBritish Virgin IslandsBrunei DarussalamBulgariaBurkina FasoBurundiCabo VerdeCambodiaCameroonCanadaCaribbean small statesCayman IslandsCentral African RepublicCentral Europe and the BalticsChadChannel IslandsChileChinaColombiaComorosCongo, Dem. Rep.Congo, Rep.Costa RicaCote d'IvoireCroatiaCubaCuracaoCyprusCzech RepublicDenmarkDjiboutiDominicaDominican RepublicEarly-demographic dividendEast Asia & PacificEast Asia & Pacific (excluding high income)East Asia & Pacific (IDA & IBRD countries)EcuadorEgypt, Arab Rep.El SalvadorEquatorial GuineaEritreaEstoniaEthiopiaEuro areaEurope & Central AsiaEurope & Central Asia (excluding high income)Europe & Central Asia (IDA & IBRD countries)European UnionFaroe IslandsFijiFinlandFragile and conflict affected situationsFranceFrench PolynesiaGabonGambia, TheGeorgiaGermanyGhanaGibraltarGreeceGreenlandGrenadaGuamGuatemalaGuineaGuinea-BissauGuyanaHaitiHeavily indebted poor countries (HIPC)High incomeHondurasHong Kong SAR, ChinaHungaryIBRD onlyIcelandIDA & IBRD totalIDA blendIDA onlyIDA totalIndiaIndonesiaIran, Islamic Rep.IraqIrelandIsle of ManIsraelItalyJamaicaJapanJordanKazakhstanKenyaKiribatiKorea, Dem. People’s Rep.Korea, Rep.KuwaitKyrgyz RepublicLao PDRLate-demographic dividendLatin America & Caribbean Latin America & Caribbean (excluding high income)Latin America & the Caribbean (IDA & IBRD countries)LatviaLeast developed countries: UN classificationLebanonLesothoLiberiaLibyaLiechtensteinLithuaniaLow & middle incomeLow incomeLower middle incomeLuxembourgMacao SAR, ChinaMacedonia, FYRMadagascarMalawiMalaysiaMaldivesMaliMaltaMarshall IslandsMauritaniaMauritiusMexicoMicronesia, Fed. Sts.Middle East & North AfricaMiddle East & North Africa (excluding high income)Middle East & North Africa (IDA & IBRD countries)Middle incomeMoldovaMonacoMongoliaMontenegroMoroccoMozambiqueMyanmarNamibiaNauruNepalNetherlandsNew CaledoniaNew ZealandNicaraguaNigerNigeriaNorth AmericaNorthern Mariana IslandsNorwayOECD membersOmanOther small statesPacific island small statesPakistanPalauPanamaPapua New GuineaParaguayPeruPhilippinesPolandPortugalPost-demographic dividendPre-demographic dividendPuerto RicoQatarRomaniaRussian FederationRwandaSamoaSan MarinoSao Tome and PrincipeSaudi ArabiaSenegalSerbiaSeychellesSierra LeoneSingaporeSint Maarten (Dutch part)Slovak RepublicSloveniaSmall statesSolomon IslandsSomaliaSouth AfricaSouth AsiaSouth Asia (IDA & IBRD)South SudanSpainSri LankaSt. Kitts and NevisSt. LuciaSt. Vincent and the GrenadinesSub-Saharan Africa Sub-Saharan Africa (excluding high income)Sub-Saharan Africa (IDA & IBRD countries)SudanSurinameSwazilandSwedenSwitzerlandSyrian Arab RepublicTajikistanTanzaniaThailandTimor-LesteTogoTongaTrinidad and TobagoTunisiaTurkeyTurkmenistanTurks and Caicos IslandsTuvaluUgandaUkraineUnited Arab EmiratesUnited KingdomUnited StatesUpper middle incomeUruguayUzbekistanVanuatuVenezuela, RBVietnamVirgin Islands (U.S.)West Bank and GazaWorldYemen, Rep.ZambiaZimbabwe Timeline:
This timeline shows a graph from 1961 to 2016 of Estonia. No data until 1960. Number of actual observations by date: 56.
Source name:
World Development Indicators
Source organization:
World Bank Staff estimates based on United Nations, World Urbanization Prospects.
Categories, topics:
Climate Change, Urban Development
Last updated:
apr 23, 2017
Indicators value changes by year
Minimum:
-2.837
jan 1, 1994
At the date of observation
Value
Absolute change
Change from previous value
jan 1, 1961
2.028
+2.028
0.0%
jan 1, 1962
2.443
+0.414
20.44%
jan 1, 1963
2.65
+0.208
8.5%
jan 1, 1964
2.664
+0.013
0.5%
jan 1, 1965
2.7
+0.036
1.36%
jan 1, 1966
2.593
-0.107
-3.96%
jan 1, 1967
2.292
-0.301
-11.62%
jan 1, 1968
1.976
-0.316
-13.79%
jan 1, 1969
2.093
+0.118
5.97%
jan 1, 1970
2.19
+0.097
4.63%
jan 1, 1971
2.087
-0.104
-4.74%
jan 1, 1972
2.055
-0.031
-1.5%
jan 1, 1973
1.936
-0.119
-5.79%
jan 1, 1974
1.757
-0.18
-9.27%
jan 1, 1975
1.65
-0.107
-6.09%
jan 1, 1976
1.558
-0.092
-5.57%
jan 1, 1977
1.475
-0.083
-5.33%
jan 1, 1978
1.483
+0.009
0.59%
jan 1, 1979
1.422
-0.062
-4.16%
jan 1, 1980
1.094
-0.327
-23.02%
jan 1, 1981
0.911
-0.184
-16.77%
jan 1, 1982
1.01
+0.099
10.87%
jan 1, 1983
1.023
+0.013
1.26%
jan 1, 1984
0.987
-0.035
-3.44%
jan 1, 1985
0.952
-0.036
-3.62%
jan 1, 1986
0.963
+0.011
1.17%
jan 1, 1987
1.037
+0.074
7.72%
jan 1, 1988
1.071
+0.034
3.24%
jan 1, 1989
0.912
-0.159
-14.82%
jan 1, 1990
0.433
-0.479
-52.5%
jan 1, 1991
-0.192
-0.625
-144.21%
jan 1, 1992
-0.762
-0.571
297.93%
jan 1, 1993
-2.086
-1.324
173.73%
jan 1, 1994
-2.837
-0.751
35.99%
jan 1, 1995
-2.404
+0.434
-15.28%
jan 1, 1996
-2.051
+0.353
-14.67%
jan 1, 1997
-1.745
+0.306
-14.94%
jan 1, 1998
-1.409
+0.335
-19.21%
jan 1, 1999
-1.233
+0.177
-12.54%
jan 1, 2000
-0.673
+0.56
-45.41%
jan 1, 2001
0.926
+1.599
-237.66%
jan 1, 2002
-0.819
-1.745
-188.38%
jan 1, 2003
-0.816
+0.003
-0.39%
jan 1, 2004
-0.812
+0.004
-0.49%
jan 1, 2005
-0.782
+0.029
-3.63%
jan 1, 2006
-0.757
+0.025
-3.24%
jan 1, 2007
-0.776
-0.019
2.55%
jan 1, 2008
-0.643
+0.133
-17.15%
jan 1, 2009
-0.455
+0.188
-29.2%
jan 1, 2010
-0.38
+0.075
-16.49%
jan 1, 2011
-0.417
-0.037
9.75%
jan 1, 2012
-0.493
-0.076
18.21%
jan 1, 2013
-0.549
-0.056
11.38%
jan 1, 2014
-0.524
+0.025
-4.61%
jan 1, 2015
-0.409
+0.116
-22.05%
jan 1, 2016
-0.318
+0.09
-22.09%
Ranking of countries by current statistics by years


Comments: