29
/
en
AIzaSyAYiBZKx7MnpbEhh9jyipgxe19OcubqV5w
April 1, 2024
86729
Bhutan
BTN
true
2
1
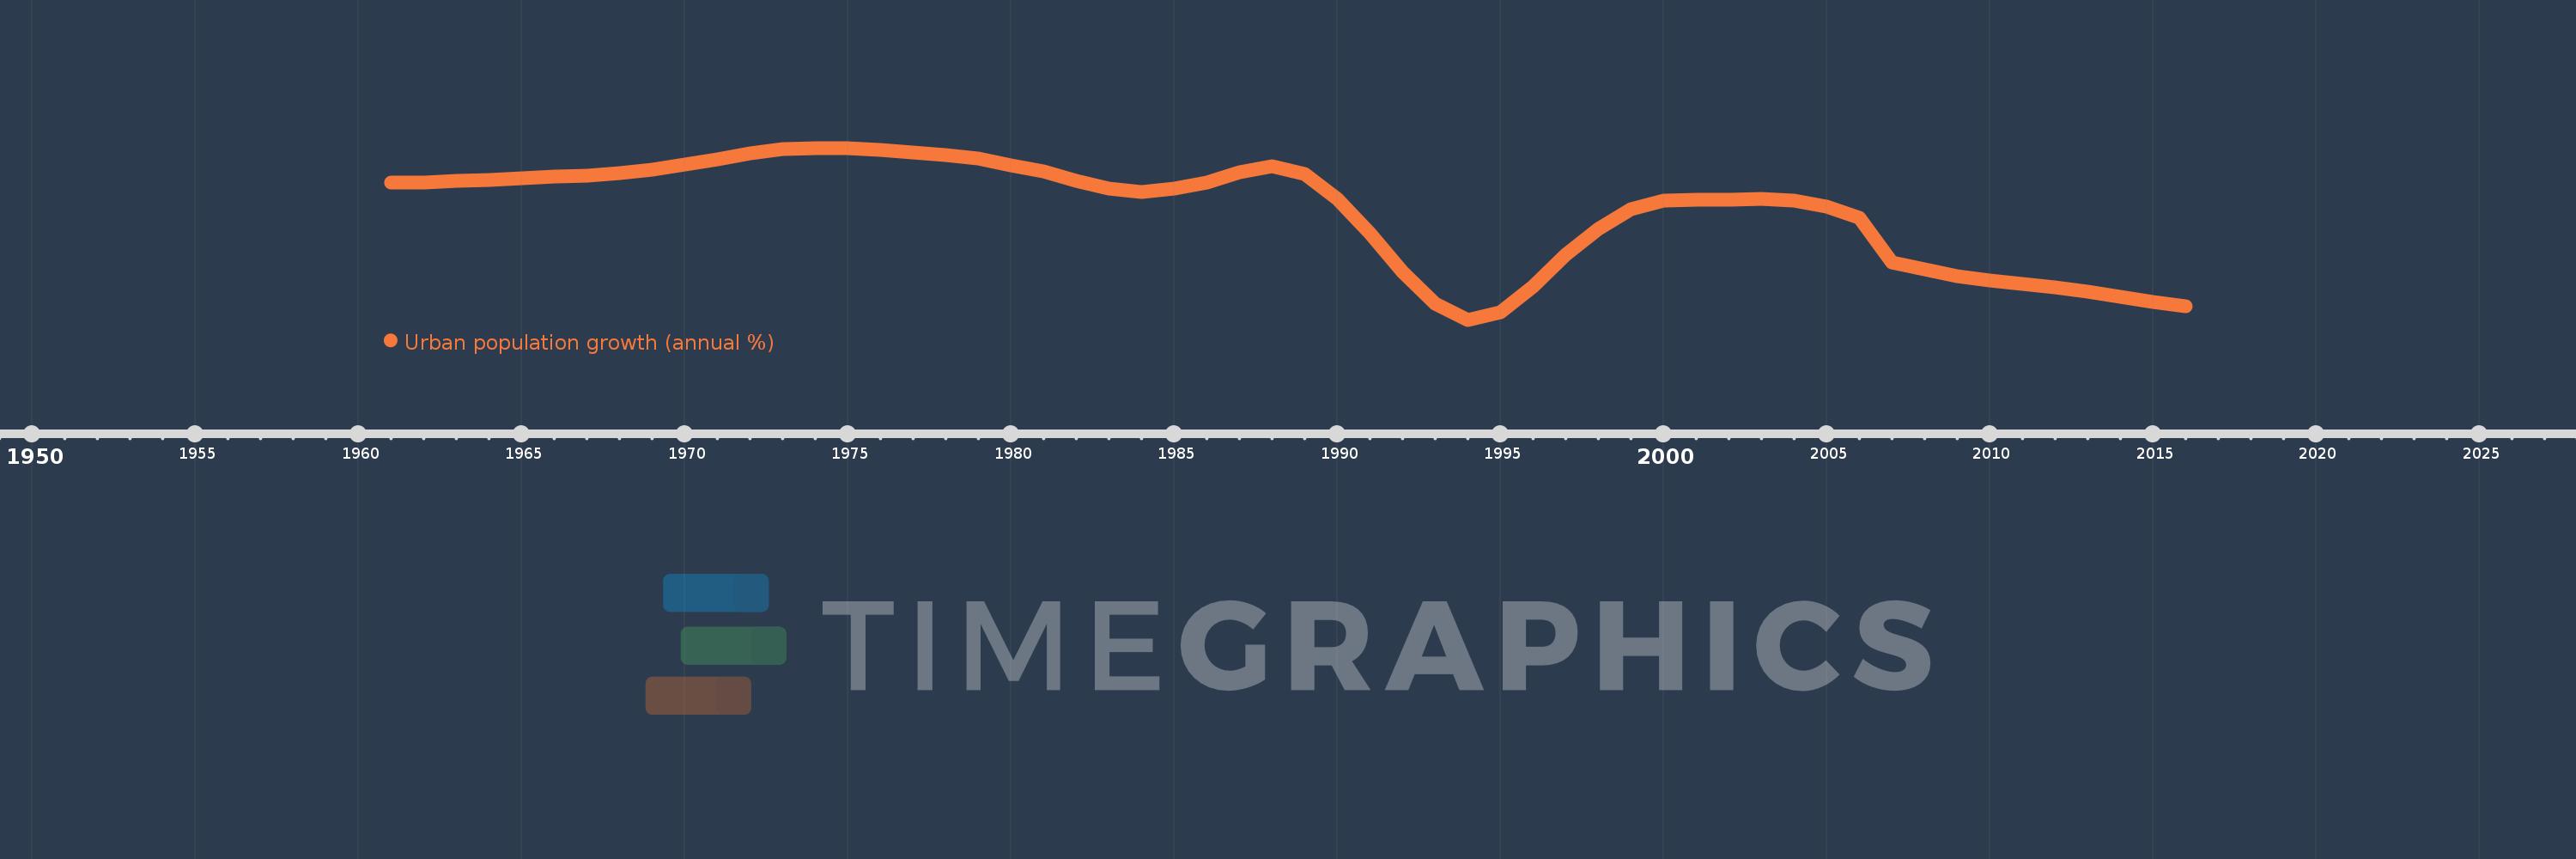
Urban population growth (annual %)
2016,2015,2014,2013,2012,2011,2010,2009,2008,2007,2006,2005,2004,2003,2002,2001,2000,1999,1998,1997,1996,1995,1994,1993,1992,1991,1990,1989,1988,1987,1986,1985,1984,1983,1982,1981,1980,1979,1978,1977,1976,1975,1974,1973,1972,1971,1970,1969,1968,1967,1966,1965,1964,1963,1962,1961
This statistics in other country:
AfghanistanAlbaniaAlgeriaAmerican SamoaAndorraAngolaAntigua and BarbudaArab WorldArgentinaArmeniaArubaAustraliaAustriaAzerbaijanBahamas, TheBahrainBangladeshBarbadosBelarusBelgiumBelizeBeninBermudaBhutanBoliviaBosnia and HerzegovinaBotswanaBrazilBritish Virgin IslandsBrunei DarussalamBulgariaBurkina FasoBurundiCabo VerdeCambodiaCameroonCanadaCaribbean small statesCayman IslandsCentral African RepublicCentral Europe and the BalticsChadChannel IslandsChileChinaColombiaComorosCongo, Dem. Rep.Congo, Rep.Costa RicaCote d'IvoireCroatiaCubaCuracaoCyprusCzech RepublicDenmarkDjiboutiDominicaDominican RepublicEarly-demographic dividendEast Asia & PacificEast Asia & Pacific (excluding high income)East Asia & Pacific (IDA & IBRD countries)EcuadorEgypt, Arab Rep.El SalvadorEquatorial GuineaEritreaEstoniaEthiopiaEuro areaEurope & Central AsiaEurope & Central Asia (excluding high income)Europe & Central Asia (IDA & IBRD countries)European UnionFaroe IslandsFijiFinlandFragile and conflict affected situationsFranceFrench PolynesiaGabonGambia, TheGeorgiaGermanyGhanaGibraltarGreeceGreenlandGrenadaGuamGuatemalaGuineaGuinea-BissauGuyanaHaitiHeavily indebted poor countries (HIPC)High incomeHondurasHong Kong SAR, ChinaHungaryIBRD onlyIcelandIDA & IBRD totalIDA blendIDA onlyIDA totalIndiaIndonesiaIran, Islamic Rep.IraqIrelandIsle of ManIsraelItalyJamaicaJapanJordanKazakhstanKenyaKiribatiKorea, Dem. People’s Rep.Korea, Rep.KuwaitKyrgyz RepublicLao PDRLate-demographic dividendLatin America & Caribbean Latin America & Caribbean (excluding high income)Latin America & the Caribbean (IDA & IBRD countries)LatviaLeast developed countries: UN classificationLebanonLesothoLiberiaLibyaLiechtensteinLithuaniaLow & middle incomeLow incomeLower middle incomeLuxembourgMacao SAR, ChinaMacedonia, FYRMadagascarMalawiMalaysiaMaldivesMaliMaltaMarshall IslandsMauritaniaMauritiusMexicoMicronesia, Fed. Sts.Middle East & North AfricaMiddle East & North Africa (excluding high income)Middle East & North Africa (IDA & IBRD countries)Middle incomeMoldovaMonacoMongoliaMontenegroMoroccoMozambiqueMyanmarNamibiaNauruNepalNetherlandsNew CaledoniaNew ZealandNicaraguaNigerNigeriaNorth AmericaNorthern Mariana IslandsNorwayOECD membersOmanOther small statesPacific island small statesPakistanPalauPanamaPapua New GuineaParaguayPeruPhilippinesPolandPortugalPost-demographic dividendPre-demographic dividendPuerto RicoQatarRomaniaRussian FederationRwandaSamoaSan MarinoSao Tome and PrincipeSaudi ArabiaSenegalSerbiaSeychellesSierra LeoneSingaporeSint Maarten (Dutch part)Slovak RepublicSloveniaSmall statesSolomon IslandsSomaliaSouth AfricaSouth AsiaSouth Asia (IDA & IBRD)South SudanSpainSri LankaSt. Kitts and NevisSt. LuciaSt. Vincent and the GrenadinesSub-Saharan Africa Sub-Saharan Africa (excluding high income)Sub-Saharan Africa (IDA & IBRD countries)SudanSurinameSwazilandSwedenSwitzerlandSyrian Arab RepublicTajikistanTanzaniaThailandTimor-LesteTogoTongaTrinidad and TobagoTunisiaTurkeyTurkmenistanTurks and Caicos IslandsTuvaluUgandaUkraineUnited Arab EmiratesUnited KingdomUnited StatesUpper middle incomeUruguayUzbekistanVanuatuVenezuela, RBVietnamVirgin Islands (U.S.)West Bank and GazaWorldYemen, Rep.ZambiaZimbabwe Timeline:
This timeline shows a graph from 1961 to 2016 of Bhutan. No data until 1960. Number of actual observations by date: 56.
Source name:
World Development Indicators
Source organization:
World Bank Staff estimates based on United Nations, World Urbanization Prospects.
Categories, topics:
Climate Change, Urban Development
Last updated:
apr 23, 2017
Indicators value changes by year
At the date of observation
Value
Absolute change
Change from previous value
jan 1, 1961
7.603
+7.603
0.0%
jan 1, 1962
7.596
-0.007
-0.09%
jan 1, 1963
7.647
+0.051
0.67%
jan 1, 1964
7.687
+0.04
0.53%
jan 1, 1965
7.743
+0.055
0.72%
jan 1, 1966
7.805
+0.062
0.8%
jan 1, 1967
7.85
+0.046
0.58%
jan 1, 1968
7.937
+0.087
1.11%
jan 1, 1969
8.041
+0.104
1.31%
jan 1, 1970
8.224
+0.183
2.27%
jan 1, 1971
8.413
+0.19
2.3%
jan 1, 1972
8.622
+0.209
2.48%
jan 1, 1973
8.783
+0.162
1.87%
jan 1, 1974
8.822
+0.039
0.44%
jan 1, 1975
8.824
+0.001
0.02%
jan 1, 1976
8.742
-0.081
-0.92%
jan 1, 1977
8.675
-0.068
-0.77%
jan 1, 1978
8.559
-0.116
-1.33%
jan 1, 1979
8.437
-0.122
-1.43%
jan 1, 1980
8.219
-0.218
-2.58%
jan 1, 1981
7.988
-0.231
-2.82%
jan 1, 1982
7.656
-0.331
-4.15%
jan 1, 1983
7.377
-0.279
-3.64%
jan 1, 1984
7.26
-0.118
-1.6%
jan 1, 1985
7.398
+0.138
1.9%
jan 1, 1986
7.604
+0.206
2.79%
jan 1, 1987
7.974
+0.37
4.87%
jan 1, 1988
8.18
+0.206
2.58%
jan 1, 1989
7.891
-0.289
-3.54%
jan 1, 1990
7.019
-0.872
-11.05%
jan 1, 1991
5.809
-1.21
-17.24%
jan 1, 1992
4.454
-1.356
-23.33%
jan 1, 1993
3.322
-1.132
-25.42%
jan 1, 1994
2.747
-0.574
-17.29%
jan 1, 1995
3.015
+0.267
9.74%
jan 1, 1996
3.933
+0.919
30.47%
jan 1, 1997
5.06
+1.126
28.64%
jan 1, 1998
5.963
+0.903
17.86%
jan 1, 1999
6.653
+0.689
11.56%
jan 1, 2000
6.964
+0.311
4.68%
jan 1, 2001
6.998
+0.034
0.48%
jan 1, 2002
6.993
-0.005
-0.07%
jan 1, 2003
7.025
+0.033
0.47%
jan 1, 2004
6.947
-0.078
-1.12%
jan 1, 2005
6.761
-0.186
-2.68%
jan 1, 2006
6.352
-0.409
-6.05%
jan 1, 2007
4.775
-1.577
-24.83%
jan 1, 2008
4.517
-0.257
-5.39%
jan 1, 2009
4.299
-0.218
-4.83%
jan 1, 2010
4.133
-0.166
-3.87%
jan 1, 2011
4.015
-0.118
-2.85%
jan 1, 2012
3.903
-0.112
-2.78%
jan 1, 2013
3.73
-0.173
-4.44%
jan 1, 2014
3.556
-0.174
-4.66%
jan 1, 2015
3.388
-0.168
-4.73%
jan 1, 2016
3.225
-0.163
-4.81%
Ranking of countries by current statistics by years


Comments: