29
/
en
AIzaSyAYiBZKx7MnpbEhh9jyipgxe19OcubqV5w
April 1, 2024
203757
Mozambique
MOZ
true
2
1
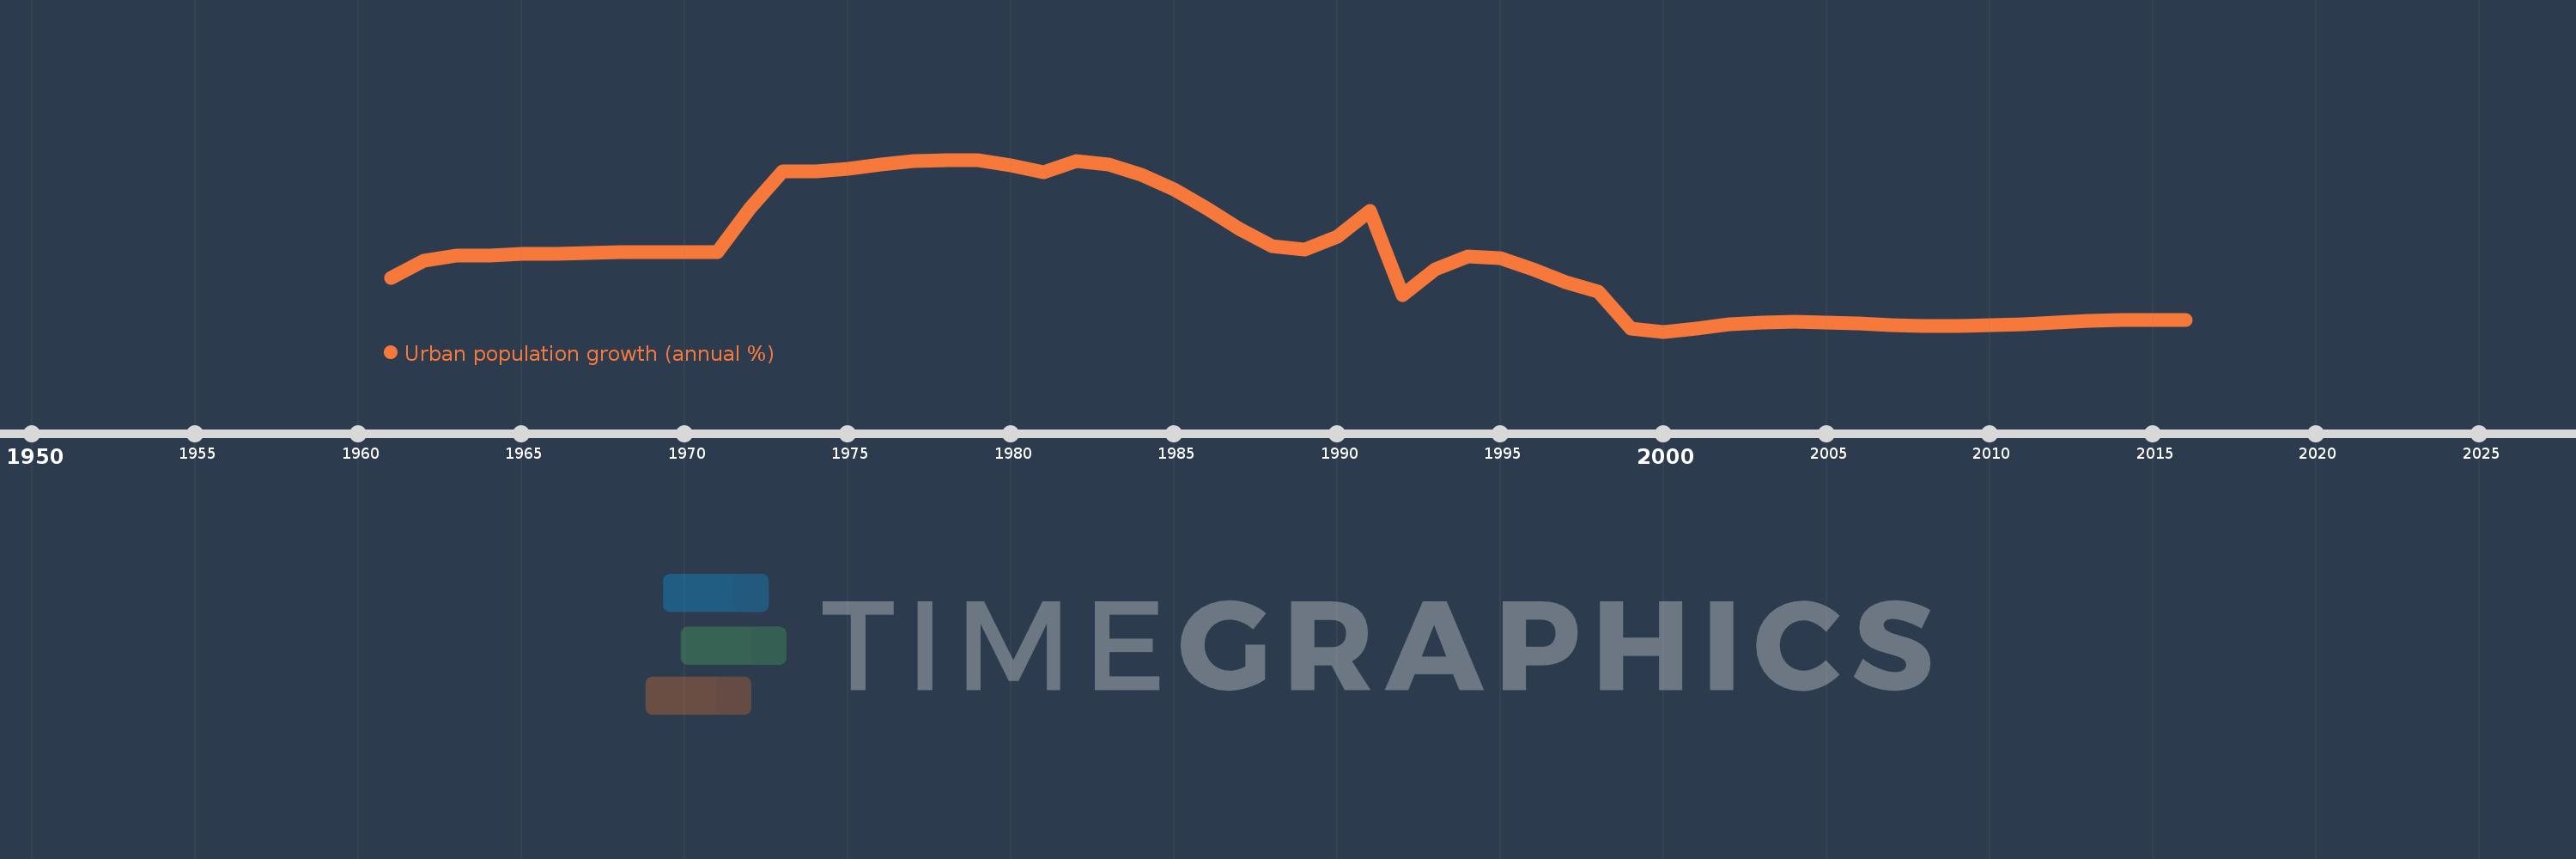
Urban population growth (annual %)
2016,2015,2014,2013,2012,2011,2010,2009,2008,2007,2006,2005,2004,2003,2002,2001,2000,1999,1998,1997,1996,1995,1994,1993,1992,1991,1990,1989,1988,1987,1986,1985,1984,1983,1982,1981,1980,1979,1978,1977,1976,1975,1974,1973,1972,1971,1970,1969,1968,1967,1966,1965,1964,1963,1962,1961
This statistics in other country:
AfghanistanAlbaniaAlgeriaAmerican SamoaAndorraAngolaAntigua and BarbudaArab WorldArgentinaArmeniaArubaAustraliaAustriaAzerbaijanBahamas, TheBahrainBangladeshBarbadosBelarusBelgiumBelizeBeninBermudaBhutanBoliviaBosnia and HerzegovinaBotswanaBrazilBritish Virgin IslandsBrunei DarussalamBulgariaBurkina FasoBurundiCabo VerdeCambodiaCameroonCanadaCaribbean small statesCayman IslandsCentral African RepublicCentral Europe and the BalticsChadChannel IslandsChileChinaColombiaComorosCongo, Dem. Rep.Congo, Rep.Costa RicaCote d'IvoireCroatiaCubaCuracaoCyprusCzech RepublicDenmarkDjiboutiDominicaDominican RepublicEarly-demographic dividendEast Asia & PacificEast Asia & Pacific (excluding high income)East Asia & Pacific (IDA & IBRD countries)EcuadorEgypt, Arab Rep.El SalvadorEquatorial GuineaEritreaEstoniaEthiopiaEuro areaEurope & Central AsiaEurope & Central Asia (excluding high income)Europe & Central Asia (IDA & IBRD countries)European UnionFaroe IslandsFijiFinlandFragile and conflict affected situationsFranceFrench PolynesiaGabonGambia, TheGeorgiaGermanyGhanaGibraltarGreeceGreenlandGrenadaGuamGuatemalaGuineaGuinea-BissauGuyanaHaitiHeavily indebted poor countries (HIPC)High incomeHondurasHong Kong SAR, ChinaHungaryIBRD onlyIcelandIDA & IBRD totalIDA blendIDA onlyIDA totalIndiaIndonesiaIran, Islamic Rep.IraqIrelandIsle of ManIsraelItalyJamaicaJapanJordanKazakhstanKenyaKiribatiKorea, Dem. People’s Rep.Korea, Rep.KuwaitKyrgyz RepublicLao PDRLate-demographic dividendLatin America & Caribbean Latin America & Caribbean (excluding high income)Latin America & the Caribbean (IDA & IBRD countries)LatviaLeast developed countries: UN classificationLebanonLesothoLiberiaLibyaLiechtensteinLithuaniaLow & middle incomeLow incomeLower middle incomeLuxembourgMacao SAR, ChinaMacedonia, FYRMadagascarMalawiMalaysiaMaldivesMaliMaltaMarshall IslandsMauritaniaMauritiusMexicoMicronesia, Fed. Sts.Middle East & North AfricaMiddle East & North Africa (excluding high income)Middle East & North Africa (IDA & IBRD countries)Middle incomeMoldovaMonacoMongoliaMontenegroMoroccoMozambiqueMyanmarNamibiaNauruNepalNetherlandsNew CaledoniaNew ZealandNicaraguaNigerNigeriaNorth AmericaNorthern Mariana IslandsNorwayOECD membersOmanOther small statesPacific island small statesPakistanPalauPanamaPapua New GuineaParaguayPeruPhilippinesPolandPortugalPost-demographic dividendPre-demographic dividendPuerto RicoQatarRomaniaRussian FederationRwandaSamoaSan MarinoSao Tome and PrincipeSaudi ArabiaSenegalSerbiaSeychellesSierra LeoneSingaporeSint Maarten (Dutch part)Slovak RepublicSloveniaSmall statesSolomon IslandsSomaliaSouth AfricaSouth AsiaSouth Asia (IDA & IBRD)South SudanSpainSri LankaSt. Kitts and NevisSt. LuciaSt. Vincent and the GrenadinesSub-Saharan Africa Sub-Saharan Africa (excluding high income)Sub-Saharan Africa (IDA & IBRD countries)SudanSurinameSwazilandSwedenSwitzerlandSyrian Arab RepublicTajikistanTanzaniaThailandTimor-LesteTogoTongaTrinidad and TobagoTunisiaTurkeyTurkmenistanTurks and Caicos IslandsTuvaluUgandaUkraineUnited Arab EmiratesUnited KingdomUnited StatesUpper middle incomeUruguayUzbekistanVanuatuVenezuela, RBVietnamVirgin Islands (U.S.)West Bank and GazaWorldYemen, Rep.ZambiaZimbabwe Timeline:
This timeline shows a graph from 1961 to 2016 of Mozambique. No data until 1960. Number of actual observations by date: 56.
Source name:
World Development Indicators
Source organization:
World Bank Staff estimates based on United Nations, World Urbanization Prospects.
Categories, topics:
Climate Change, Urban Development
Last updated:
apr 23, 2017
Indicators value changes by year
At the date of observation
Value
Absolute change
Change from previous value
jan 1, 1961
5.092
+5.092
0.0%
jan 1, 1962
5.687
+0.595
11.69%
jan 1, 1963
5.886
+0.199
3.51%
jan 1, 1964
5.89
+0.003
0.05%
jan 1, 1965
5.94
+0.05
0.85%
jan 1, 1966
5.926
-0.013
-0.23%
jan 1, 1967
5.965
+0.039
0.66%
jan 1, 1968
5.983
+0.018
0.3%
jan 1, 1969
6.006
+0.022
0.37%
jan 1, 1970
5.984
-0.021
-0.35%
jan 1, 1971
6.002
+0.018
0.3%
jan 1, 1972
7.537
+1.535
25.57%
jan 1, 1973
8.813
+1.276
16.93%
jan 1, 1974
8.818
+0.005
0.06%
jan 1, 1975
8.919
+0.101
1.14%
jan 1, 1976
9.048
+0.129
1.45%
jan 1, 1977
9.185
+0.137
1.52%
jan 1, 1978
9.222
+0.037
0.4%
jan 1, 1979
9.195
-0.027
-0.3%
jan 1, 1980
9.035
-0.16
-1.74%
jan 1, 1981
8.801
-0.234
-2.59%
jan 1, 1982
9.19
+0.388
4.41%
jan 1, 1983
9.059
-0.13
-1.42%
jan 1, 1984
8.7
-0.36
-3.97%
jan 1, 1985
8.173
-0.526
-6.05%
jan 1, 1986
7.537
-0.636
-7.79%
jan 1, 1987
6.818
-0.719
-9.54%
jan 1, 1988
6.219
-0.599
-8.78%
jan 1, 1989
6.087
-0.132
-2.13%
jan 1, 1990
6.537
+0.45
7.4%
jan 1, 1991
7.428
+0.891
13.62%
jan 1, 1992
4.498
-2.93
-39.45%
jan 1, 1993
5.384
+0.886
19.7%
jan 1, 1994
5.85
+0.466
8.66%
jan 1, 1995
5.786
-0.064
-1.09%
jan 1, 1996
5.394
-0.393
-6.78%
jan 1, 1997
4.946
-0.448
-8.3%
jan 1, 1998
4.623
-0.323
-6.52%
jan 1, 1999
3.323
-1.3
-28.13%
jan 1, 2000
3.22
-0.103
-3.09%
jan 1, 2001
3.336
+0.115
3.58%
jan 1, 2002
3.462
+0.126
3.79%
jan 1, 2003
3.531
+0.068
1.97%
jan 1, 2004
3.562
+0.031
0.88%
jan 1, 2005
3.549
-0.012
-0.35%
jan 1, 2006
3.503
-0.046
-1.29%
jan 1, 2007
3.46
-0.043
-1.24%
jan 1, 2008
3.421
-0.039
-1.12%
jan 1, 2009
3.406
-0.016
-0.46%
jan 1, 2010
3.443
+0.037
1.09%
jan 1, 2011
3.49
+0.047
1.36%
jan 1, 2012
3.54
+0.051
1.46%
jan 1, 2013
3.582
+0.042
1.19%
jan 1, 2014
3.612
+0.03
0.84%
jan 1, 2015
3.624
+0.012
0.33%
jan 1, 2016
3.633
+0.009
0.24%
Ranking of countries by current statistics by years


Comments: