29
/
en
AIzaSyAYiBZKx7MnpbEhh9jyipgxe19OcubqV5w
April 1, 2024
148728
Guyana
GUY
true
2
1
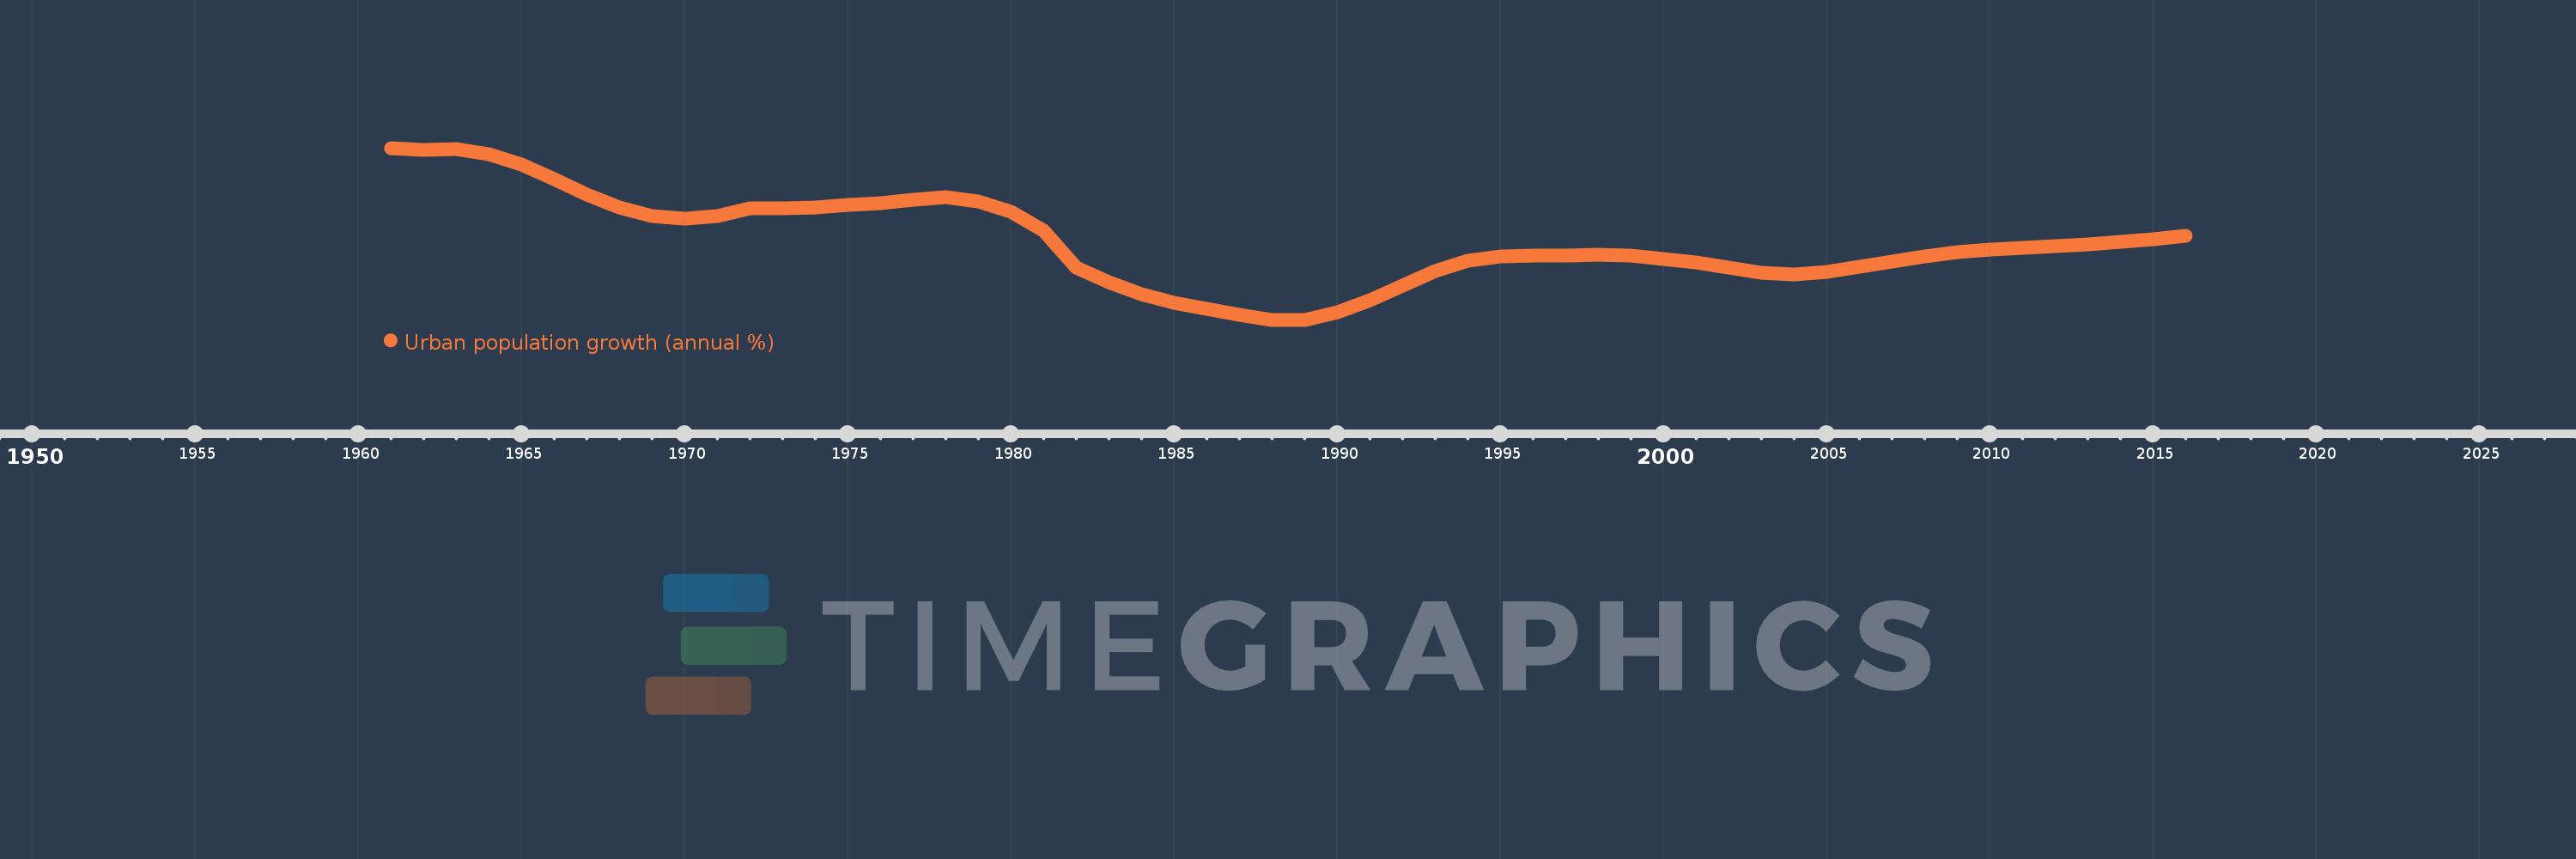
Urban population growth (annual %)
2016,2015,2014,2013,2012,2011,2010,2009,2008,2007,2006,2005,2004,2003,2002,2001,2000,1999,1998,1997,1996,1995,1994,1993,1992,1991,1990,1989,1988,1987,1986,1985,1984,1983,1982,1981,1980,1979,1978,1977,1976,1975,1974,1973,1972,1971,1970,1969,1968,1967,1966,1965,1964,1963,1962,1961
This statistics in other country:
AfghanistanAlbaniaAlgeriaAmerican SamoaAndorraAngolaAntigua and BarbudaArab WorldArgentinaArmeniaArubaAustraliaAustriaAzerbaijanBahamas, TheBahrainBangladeshBarbadosBelarusBelgiumBelizeBeninBermudaBhutanBoliviaBosnia and HerzegovinaBotswanaBrazilBritish Virgin IslandsBrunei DarussalamBulgariaBurkina FasoBurundiCabo VerdeCambodiaCameroonCanadaCaribbean small statesCayman IslandsCentral African RepublicCentral Europe and the BalticsChadChannel IslandsChileChinaColombiaComorosCongo, Dem. Rep.Congo, Rep.Costa RicaCote d'IvoireCroatiaCubaCuracaoCyprusCzech RepublicDenmarkDjiboutiDominicaDominican RepublicEarly-demographic dividendEast Asia & PacificEast Asia & Pacific (excluding high income)East Asia & Pacific (IDA & IBRD countries)EcuadorEgypt, Arab Rep.El SalvadorEquatorial GuineaEritreaEstoniaEthiopiaEuro areaEurope & Central AsiaEurope & Central Asia (excluding high income)Europe & Central Asia (IDA & IBRD countries)European UnionFaroe IslandsFijiFinlandFragile and conflict affected situationsFranceFrench PolynesiaGabonGambia, TheGeorgiaGermanyGhanaGibraltarGreeceGreenlandGrenadaGuamGuatemalaGuineaGuinea-BissauGuyanaHaitiHeavily indebted poor countries (HIPC)High incomeHondurasHong Kong SAR, ChinaHungaryIBRD onlyIcelandIDA & IBRD totalIDA blendIDA onlyIDA totalIndiaIndonesiaIran, Islamic Rep.IraqIrelandIsle of ManIsraelItalyJamaicaJapanJordanKazakhstanKenyaKiribatiKorea, Dem. People’s Rep.Korea, Rep.KuwaitKyrgyz RepublicLao PDRLate-demographic dividendLatin America & Caribbean Latin America & Caribbean (excluding high income)Latin America & the Caribbean (IDA & IBRD countries)LatviaLeast developed countries: UN classificationLebanonLesothoLiberiaLibyaLiechtensteinLithuaniaLow & middle incomeLow incomeLower middle incomeLuxembourgMacao SAR, ChinaMacedonia, FYRMadagascarMalawiMalaysiaMaldivesMaliMaltaMarshall IslandsMauritaniaMauritiusMexicoMicronesia, Fed. Sts.Middle East & North AfricaMiddle East & North Africa (excluding high income)Middle East & North Africa (IDA & IBRD countries)Middle incomeMoldovaMonacoMongoliaMontenegroMoroccoMozambiqueMyanmarNamibiaNauruNepalNetherlandsNew CaledoniaNew ZealandNicaraguaNigerNigeriaNorth AmericaNorthern Mariana IslandsNorwayOECD membersOmanOther small statesPacific island small statesPakistanPalauPanamaPapua New GuineaParaguayPeruPhilippinesPolandPortugalPost-demographic dividendPre-demographic dividendPuerto RicoQatarRomaniaRussian FederationRwandaSamoaSan MarinoSao Tome and PrincipeSaudi ArabiaSenegalSerbiaSeychellesSierra LeoneSingaporeSint Maarten (Dutch part)Slovak RepublicSloveniaSmall statesSolomon IslandsSomaliaSouth AfricaSouth AsiaSouth Asia (IDA & IBRD)South SudanSpainSri LankaSt. Kitts and NevisSt. LuciaSt. Vincent and the GrenadinesSub-Saharan Africa Sub-Saharan Africa (excluding high income)Sub-Saharan Africa (IDA & IBRD countries)SudanSurinameSwazilandSwedenSwitzerlandSyrian Arab RepublicTajikistanTanzaniaThailandTimor-LesteTogoTongaTrinidad and TobagoTunisiaTurkeyTurkmenistanTurks and Caicos IslandsTuvaluUgandaUkraineUnited Arab EmiratesUnited KingdomUnited StatesUpper middle incomeUruguayUzbekistanVanuatuVenezuela, RBVietnamVirgin Islands (U.S.)West Bank and GazaWorldYemen, Rep.ZambiaZimbabwe Timeline:
This timeline shows a graph from 1961 to 2016 of Guyana. No data until 1960. Number of actual observations by date: 56.
Source name:
World Development Indicators
Source organization:
World Bank Staff estimates based on United Nations, World Urbanization Prospects.
Categories, topics:
Climate Change, Urban Development
Last updated:
apr 23, 2017
Indicators value changes by year
Minimum:
-1.694
jan 1, 1988
At the date of observation
Value
Absolute change
Change from previous value
jan 1, 1961
3.316
+3.316
0.0%
jan 1, 1962
3.246
-0.07
-2.1%
jan 1, 1963
3.271
+0.025
0.77%
jan 1, 1964
3.144
-0.127
-3.9%
jan 1, 1965
2.83
-0.314
-9.99%
jan 1, 1966
2.408
-0.422
-14.92%
jan 1, 1967
1.958
-0.45
-18.68%
jan 1, 1968
1.584
-0.374
-19.1%
jan 1, 1969
1.332
-0.252
-15.91%
jan 1, 1970
1.246
-0.086
-6.44%
jan 1, 1971
1.333
+0.087
7.01%
jan 1, 1972
1.546
+0.212
15.91%
jan 1, 1973
1.548
+0.003
0.16%
jan 1, 1974
1.585
+0.037
2.39%
jan 1, 1975
1.645
+0.06
3.79%
jan 1, 1976
1.717
+0.071
4.33%
jan 1, 1977
1.817
+0.1
5.85%
jan 1, 1978
1.877
+0.06
3.29%
jan 1, 1979
1.764
-0.112
-5.98%
jan 1, 1980
1.449
-0.315
-17.85%
jan 1, 1981
0.902
-0.547
-37.75%
jan 1, 1982
-0.161
-1.063
-117.81%
jan 1, 1983
-0.588
-0.427
265.78%
jan 1, 1984
-0.948
-0.361
61.39%
jan 1, 1985
-1.211
-0.263
27.72%
jan 1, 1986
-1.376
-0.165
13.61%
jan 1, 1987
-1.542
-0.166
12.05%
jan 1, 1988
-1.694
-0.152
9.84%
jan 1, 1989
-1.691
+0.003
-0.19%
jan 1, 1990
-1.485
+0.206
-12.16%
jan 1, 1991
-1.127
+0.358
-24.11%
jan 1, 1992
-0.691
+0.436
-38.66%
jan 1, 1993
-0.286
+0.405
-58.65%
jan 1, 1994
0.016
+0.301
-105.47%
jan 1, 1995
0.156
+0.14
896.12%
jan 1, 1996
0.173
+0.017
11.06%
jan 1, 1997
0.174
+0.001
0.64%
jan 1, 1998
0.194
+0.019
11.18%
jan 1, 1999
0.166
-0.027
-14.02%
jan 1, 2000
0.08
-0.087
-52.04%
jan 1, 2001
-0.032
-0.112
-140.58%
jan 1, 2002
-0.18
-0.148
455.66%
jan 1, 2003
-0.316
-0.136
75.37%
jan 1, 2004
-0.382
-0.066
21.02%
jan 1, 2005
-0.308
+0.074
-19.4%
jan 1, 2006
-0.156
+0.152
-49.34%
jan 1, 2007
0.01
+0.166
-106.71%
jan 1, 2008
0.164
+0.154
1.47K%
jan 1, 2009
0.283
+0.119
72.66%
jan 1, 2010
0.365
+0.081
28.73%
jan 1, 2011
0.411
+0.047
12.79%
jan 1, 2012
0.447
+0.036
8.81%
jan 1, 2013
0.503
+0.056
12.46%
jan 1, 2014
0.567
+0.064
12.75%
jan 1, 2015
0.646
+0.079
13.87%
jan 1, 2016
0.747
+0.101
15.62%
Ranking of countries by current statistics by years


Comments: