29
/
en
AIzaSyAYiBZKx7MnpbEhh9jyipgxe19OcubqV5w
April 1, 2024
149870
Haiti
HTI
true
2
1
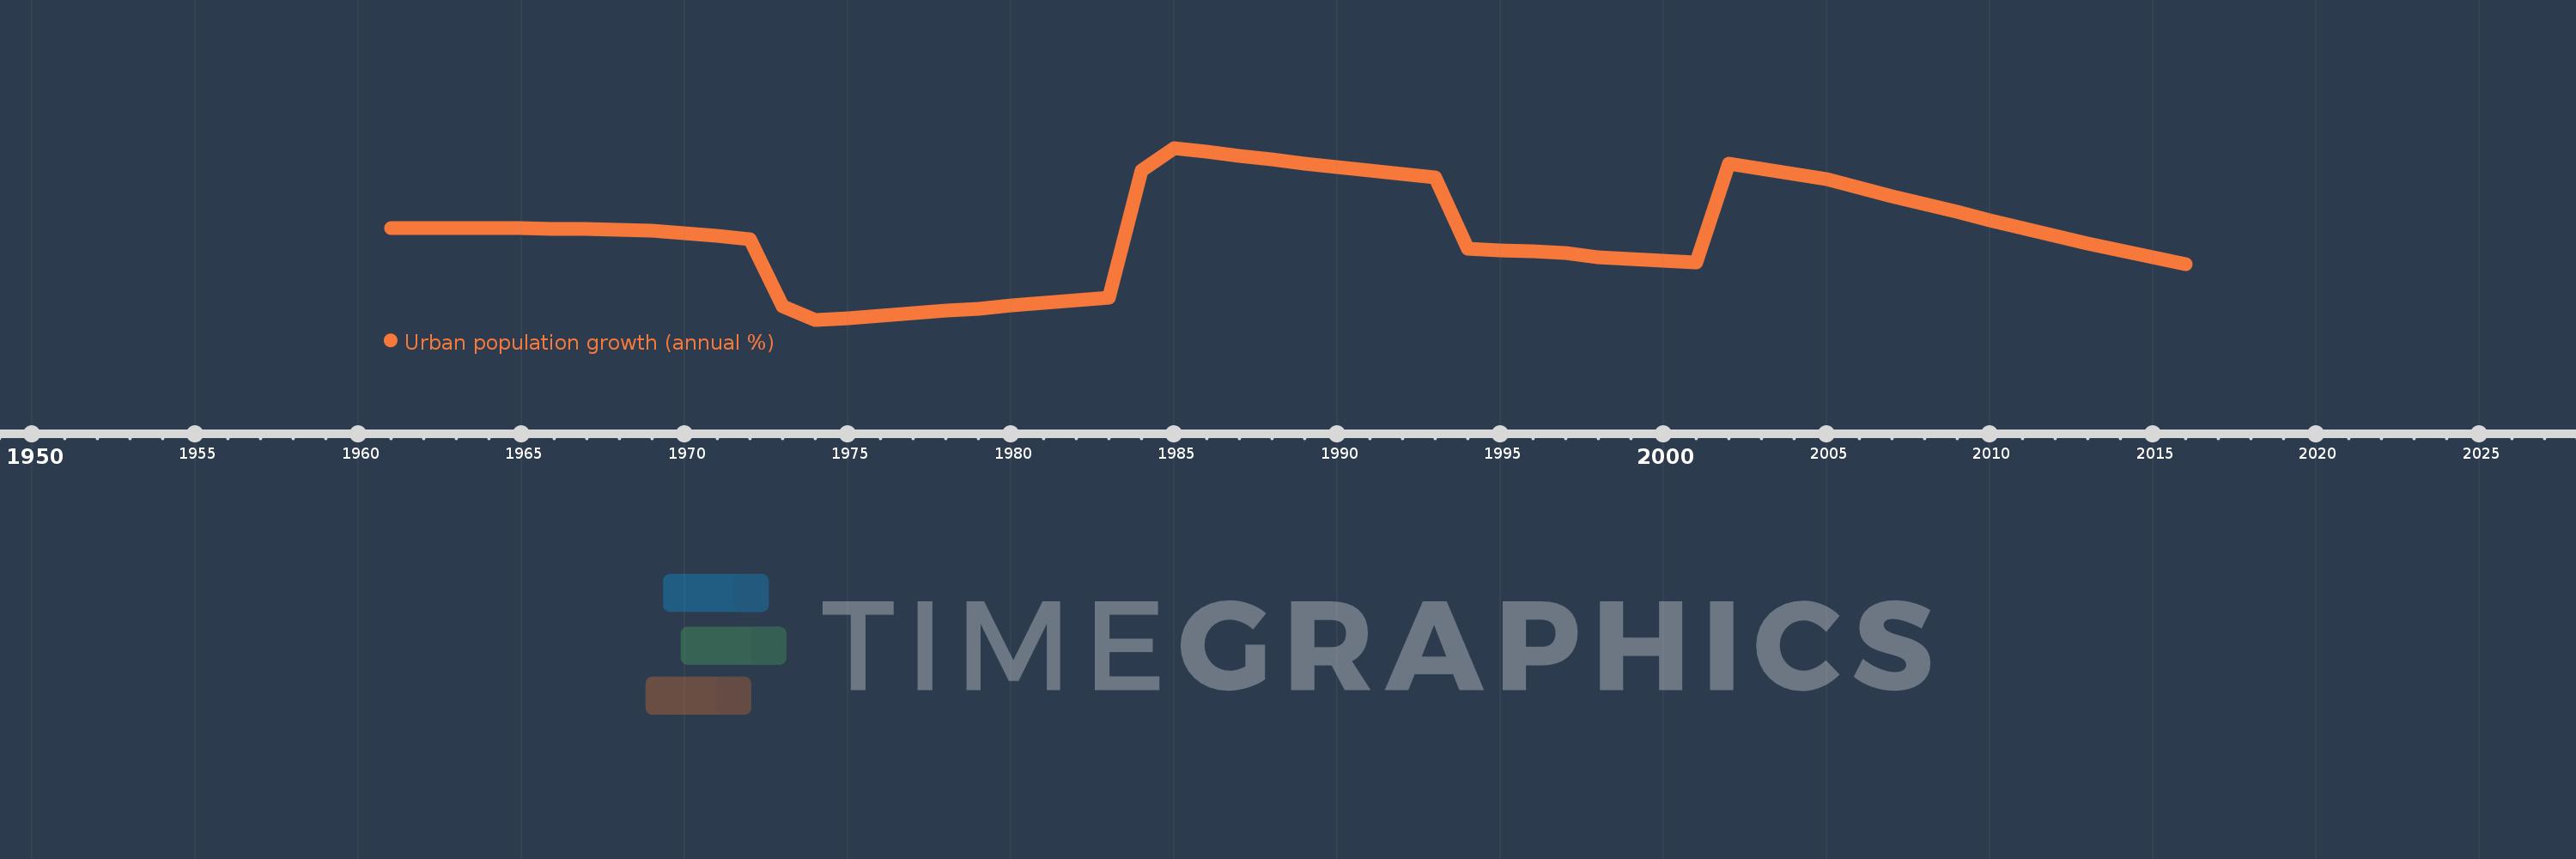
Urban population growth (annual %)
2016,2015,2014,2013,2012,2011,2010,2009,2008,2007,2006,2005,2004,2003,2002,2001,2000,1999,1998,1997,1996,1995,1994,1993,1992,1991,1990,1989,1988,1987,1986,1985,1984,1983,1982,1981,1980,1979,1978,1977,1976,1975,1974,1973,1972,1971,1970,1969,1968,1967,1966,1965,1964,1963,1962,1961
This statistics in other country:
AfghanistanAlbaniaAlgeriaAmerican SamoaAndorraAngolaAntigua and BarbudaArab WorldArgentinaArmeniaArubaAustraliaAustriaAzerbaijanBahamas, TheBahrainBangladeshBarbadosBelarusBelgiumBelizeBeninBermudaBhutanBoliviaBosnia and HerzegovinaBotswanaBrazilBritish Virgin IslandsBrunei DarussalamBulgariaBurkina FasoBurundiCabo VerdeCambodiaCameroonCanadaCaribbean small statesCayman IslandsCentral African RepublicCentral Europe and the BalticsChadChannel IslandsChileChinaColombiaComorosCongo, Dem. Rep.Congo, Rep.Costa RicaCote d'IvoireCroatiaCubaCuracaoCyprusCzech RepublicDenmarkDjiboutiDominicaDominican RepublicEarly-demographic dividendEast Asia & PacificEast Asia & Pacific (excluding high income)East Asia & Pacific (IDA & IBRD countries)EcuadorEgypt, Arab Rep.El SalvadorEquatorial GuineaEritreaEstoniaEthiopiaEuro areaEurope & Central AsiaEurope & Central Asia (excluding high income)Europe & Central Asia (IDA & IBRD countries)European UnionFaroe IslandsFijiFinlandFragile and conflict affected situationsFranceFrench PolynesiaGabonGambia, TheGeorgiaGermanyGhanaGibraltarGreeceGreenlandGrenadaGuamGuatemalaGuineaGuinea-BissauGuyanaHaitiHeavily indebted poor countries (HIPC)High incomeHondurasHong Kong SAR, ChinaHungaryIBRD onlyIcelandIDA & IBRD totalIDA blendIDA onlyIDA totalIndiaIndonesiaIran, Islamic Rep.IraqIrelandIsle of ManIsraelItalyJamaicaJapanJordanKazakhstanKenyaKiribatiKorea, Dem. People’s Rep.Korea, Rep.KuwaitKyrgyz RepublicLao PDRLate-demographic dividendLatin America & Caribbean Latin America & Caribbean (excluding high income)Latin America & the Caribbean (IDA & IBRD countries)LatviaLeast developed countries: UN classificationLebanonLesothoLiberiaLibyaLiechtensteinLithuaniaLow & middle incomeLow incomeLower middle incomeLuxembourgMacao SAR, ChinaMacedonia, FYRMadagascarMalawiMalaysiaMaldivesMaliMaltaMarshall IslandsMauritaniaMauritiusMexicoMicronesia, Fed. Sts.Middle East & North AfricaMiddle East & North Africa (excluding high income)Middle East & North Africa (IDA & IBRD countries)Middle incomeMoldovaMonacoMongoliaMontenegroMoroccoMozambiqueMyanmarNamibiaNauruNepalNetherlandsNew CaledoniaNew ZealandNicaraguaNigerNigeriaNorth AmericaNorthern Mariana IslandsNorwayOECD membersOmanOther small statesPacific island small statesPakistanPalauPanamaPapua New GuineaParaguayPeruPhilippinesPolandPortugalPost-demographic dividendPre-demographic dividendPuerto RicoQatarRomaniaRussian FederationRwandaSamoaSan MarinoSao Tome and PrincipeSaudi ArabiaSenegalSerbiaSeychellesSierra LeoneSingaporeSint Maarten (Dutch part)Slovak RepublicSloveniaSmall statesSolomon IslandsSomaliaSouth AfricaSouth AsiaSouth Asia (IDA & IBRD)South SudanSpainSri LankaSt. Kitts and NevisSt. LuciaSt. Vincent and the GrenadinesSub-Saharan Africa Sub-Saharan Africa (excluding high income)Sub-Saharan Africa (IDA & IBRD countries)SudanSurinameSwazilandSwedenSwitzerlandSyrian Arab RepublicTajikistanTanzaniaThailandTimor-LesteTogoTongaTrinidad and TobagoTunisiaTurkeyTurkmenistanTurks and Caicos IslandsTuvaluUgandaUkraineUnited Arab EmiratesUnited KingdomUnited StatesUpper middle incomeUruguayUzbekistanVanuatuVenezuela, RBVietnamVirgin Islands (U.S.)West Bank and GazaWorldYemen, Rep.ZambiaZimbabwe Timeline:
This timeline shows a graph from 1961 to 2016 of Haiti. No data until 1960. Number of actual observations by date: 56.
Source name:
World Development Indicators
Source organization:
World Bank Staff estimates based on United Nations, World Urbanization Prospects.
Categories, topics:
Climate Change, Urban Development
Last updated:
apr 23, 2017
Indicators value changes by year
At the date of observation
Value
Absolute change
Change from previous value
jan 1, 1961
4.401
+4.401
0.0%
jan 1, 1962
4.398
-0.004
-0.09%
jan 1, 1963
4.401
+0.004
0.09%
jan 1, 1964
4.394
-0.007
-0.17%
jan 1, 1965
4.393
-0.001
-0.01%
jan 1, 1966
4.37
-0.024
-0.54%
jan 1, 1967
4.368
-0.002
-0.03%
jan 1, 1968
4.35
-0.018
-0.4%
jan 1, 1969
4.319
-0.031
-0.72%
jan 1, 1970
4.248
-0.071
-1.65%
jan 1, 1971
4.166
-0.082
-1.92%
jan 1, 1972
4.08
-0.086
-2.07%
jan 1, 1973
2.223
-1.857
-45.51%
jan 1, 1974
1.843
-0.381
-17.13%
jan 1, 1975
1.877
+0.034
1.87%
jan 1, 1976
1.946
+0.069
3.7%
jan 1, 1977
2.019
+0.072
3.71%
jan 1, 1978
2.088
+0.069
3.41%
jan 1, 1979
2.154
+0.067
3.2%
jan 1, 1980
2.232
+0.078
3.62%
jan 1, 1981
2.314
+0.082
3.67%
jan 1, 1982
2.388
+0.074
3.18%
jan 1, 1983
2.452
+0.063
2.66%
jan 1, 1984
5.994
+3.543
144.51%
jan 1, 1985
6.622
+0.628
10.47%
jan 1, 1986
6.512
-0.11
-1.66%
jan 1, 1987
6.405
-0.107
-1.64%
jan 1, 1988
6.295
-0.11
-1.72%
jan 1, 1989
6.195
-0.099
-1.58%
jan 1, 1990
6.082
-0.113
-1.83%
jan 1, 1991
5.994
-0.088
-1.45%
jan 1, 1992
5.894
-0.1
-1.67%
jan 1, 1993
5.798
-0.095
-1.61%
jan 1, 1994
3.825
-1.974
-34.04%
jan 1, 1995
3.781
-0.044
-1.14%
jan 1, 1996
3.738
-0.043
-1.14%
jan 1, 1997
3.701
-0.037
-0.99%
jan 1, 1998
3.589
-0.112
-3.04%
jan 1, 1999
3.542
-0.047
-1.32%
jan 1, 2000
3.49
-0.052
-1.46%
jan 1, 2001
3.431
-0.059
-1.68%
jan 1, 2002
6.196
+2.765
80.6%
jan 1, 2003
6.044
-0.152
-2.46%
jan 1, 2004
5.891
-0.153
-2.53%
jan 1, 2005
5.759
-0.132
-2.24%
jan 1, 2006
5.509
-0.25
-4.34%
jan 1, 2007
5.287
-0.222
-4.02%
jan 1, 2008
5.064
-0.223
-4.22%
jan 1, 2009
4.839
-0.225
-4.45%
jan 1, 2010
4.613
-0.225
-4.66%
jan 1, 2011
4.39
-0.223
-4.84%
jan 1, 2012
4.173
-0.217
-4.94%
jan 1, 2013
3.967
-0.206
-4.94%
jan 1, 2014
3.766
-0.201
-5.07%
jan 1, 2015
3.573
-0.193
-5.12%
jan 1, 2016
3.39
-0.183
-5.13%
Ranking of countries by current statistics by years


Comments: