29
/
en
AIzaSyAYiBZKx7MnpbEhh9jyipgxe19OcubqV5w
April 1, 2024
173689
Kyrgyz Republic
KGZ
true
2
1
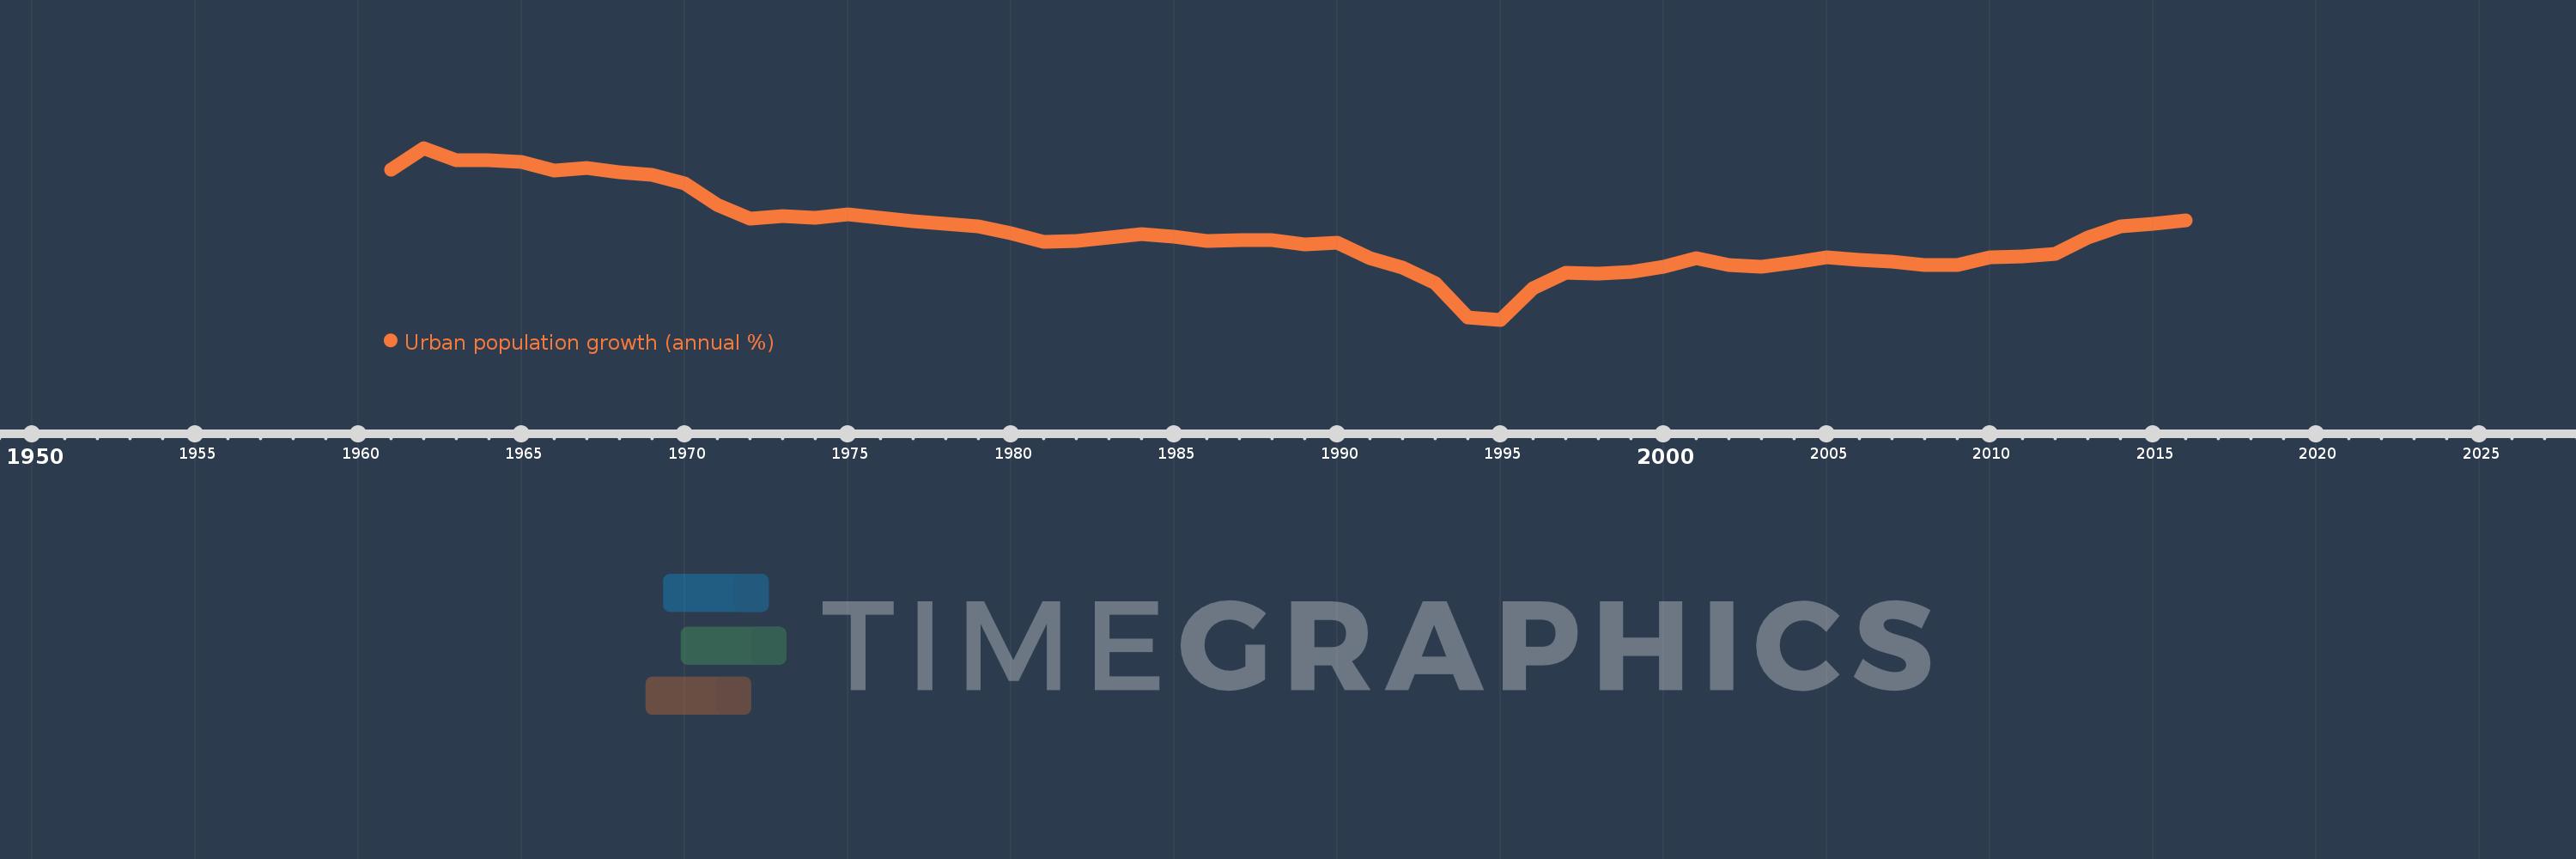
Urban population growth (annual %)
2016,2015,2014,2013,2012,2011,2010,2009,2008,2007,2006,2005,2004,2003,2002,2001,2000,1999,1998,1997,1996,1995,1994,1993,1992,1991,1990,1989,1988,1987,1986,1985,1984,1983,1982,1981,1980,1979,1978,1977,1976,1975,1974,1973,1972,1971,1970,1969,1968,1967,1966,1965,1964,1963,1962,1961
This statistics in other country:
AfghanistanAlbaniaAlgeriaAmerican SamoaAndorraAngolaAntigua and BarbudaArab WorldArgentinaArmeniaArubaAustraliaAustriaAzerbaijanBahamas, TheBahrainBangladeshBarbadosBelarusBelgiumBelizeBeninBermudaBhutanBoliviaBosnia and HerzegovinaBotswanaBrazilBritish Virgin IslandsBrunei DarussalamBulgariaBurkina FasoBurundiCabo VerdeCambodiaCameroonCanadaCaribbean small statesCayman IslandsCentral African RepublicCentral Europe and the BalticsChadChannel IslandsChileChinaColombiaComorosCongo, Dem. Rep.Congo, Rep.Costa RicaCote d'IvoireCroatiaCubaCuracaoCyprusCzech RepublicDenmarkDjiboutiDominicaDominican RepublicEarly-demographic dividendEast Asia & PacificEast Asia & Pacific (excluding high income)East Asia & Pacific (IDA & IBRD countries)EcuadorEgypt, Arab Rep.El SalvadorEquatorial GuineaEritreaEstoniaEthiopiaEuro areaEurope & Central AsiaEurope & Central Asia (excluding high income)Europe & Central Asia (IDA & IBRD countries)European UnionFaroe IslandsFijiFinlandFragile and conflict affected situationsFranceFrench PolynesiaGabonGambia, TheGeorgiaGermanyGhanaGibraltarGreeceGreenlandGrenadaGuamGuatemalaGuineaGuinea-BissauGuyanaHaitiHeavily indebted poor countries (HIPC)High incomeHondurasHong Kong SAR, ChinaHungaryIBRD onlyIcelandIDA & IBRD totalIDA blendIDA onlyIDA totalIndiaIndonesiaIran, Islamic Rep.IraqIrelandIsle of ManIsraelItalyJamaicaJapanJordanKazakhstanKenyaKiribatiKorea, Dem. People’s Rep.Korea, Rep.KuwaitKyrgyz RepublicLao PDRLate-demographic dividendLatin America & Caribbean Latin America & Caribbean (excluding high income)Latin America & the Caribbean (IDA & IBRD countries)LatviaLeast developed countries: UN classificationLebanonLesothoLiberiaLibyaLiechtensteinLithuaniaLow & middle incomeLow incomeLower middle incomeLuxembourgMacao SAR, ChinaMacedonia, FYRMadagascarMalawiMalaysiaMaldivesMaliMaltaMarshall IslandsMauritaniaMauritiusMexicoMicronesia, Fed. Sts.Middle East & North AfricaMiddle East & North Africa (excluding high income)Middle East & North Africa (IDA & IBRD countries)Middle incomeMoldovaMonacoMongoliaMontenegroMoroccoMozambiqueMyanmarNamibiaNauruNepalNetherlandsNew CaledoniaNew ZealandNicaraguaNigerNigeriaNorth AmericaNorthern Mariana IslandsNorwayOECD membersOmanOther small statesPacific island small statesPakistanPalauPanamaPapua New GuineaParaguayPeruPhilippinesPolandPortugalPost-demographic dividendPre-demographic dividendPuerto RicoQatarRomaniaRussian FederationRwandaSamoaSan MarinoSao Tome and PrincipeSaudi ArabiaSenegalSerbiaSeychellesSierra LeoneSingaporeSint Maarten (Dutch part)Slovak RepublicSloveniaSmall statesSolomon IslandsSomaliaSouth AfricaSouth AsiaSouth Asia (IDA & IBRD)South SudanSpainSri LankaSt. Kitts and NevisSt. LuciaSt. Vincent and the GrenadinesSub-Saharan Africa Sub-Saharan Africa (excluding high income)Sub-Saharan Africa (IDA & IBRD countries)SudanSurinameSwazilandSwedenSwitzerlandSyrian Arab RepublicTajikistanTanzaniaThailandTimor-LesteTogoTongaTrinidad and TobagoTunisiaTurkeyTurkmenistanTurks and Caicos IslandsTuvaluUgandaUkraineUnited Arab EmiratesUnited KingdomUnited StatesUpper middle incomeUruguayUzbekistanVanuatuVenezuela, RBVietnamVirgin Islands (U.S.)West Bank and GazaWorldYemen, Rep.ZambiaZimbabwe Timeline:
This timeline shows a graph from 1961 to 2016 of Kyrgyz Republic. No data until 1960. Number of actual observations by date: 56.
Source name:
World Development Indicators
Source organization:
World Bank Staff estimates based on United Nations, World Urbanization Prospects.
Categories, topics:
Climate Change, Urban Development
Last updated:
apr 23, 2017
Indicators value changes by year
At the date of observation
Value
Absolute change
Change from previous value
jan 1, 1961
4.035
+4.035
0.0%
jan 1, 1962
4.737
+0.702
17.4%
jan 1, 1963
4.338
-0.399
-8.42%
jan 1, 1964
4.337
-0.001
-0.01%
jan 1, 1965
4.278
-0.059
-1.36%
jan 1, 1966
4.02
-0.259
-6.05%
jan 1, 1967
4.078
+0.058
1.45%
jan 1, 1968
3.947
-0.131
-3.2%
jan 1, 1969
3.875
-0.073
-1.84%
jan 1, 1970
3.604
-0.27
-6.98%
jan 1, 1971
2.899
-0.705
-19.57%
jan 1, 1972
2.467
-0.432
-14.89%
jan 1, 1973
2.539
+0.072
2.91%
jan 1, 1974
2.483
-0.056
-2.22%
jan 1, 1975
2.58
+0.098
3.93%
jan 1, 1976
2.48
-0.1
-3.87%
jan 1, 1977
2.373
-0.108
-4.34%
jan 1, 1978
2.3
-0.072
-3.05%
jan 1, 1979
2.205
-0.095
-4.13%
jan 1, 1980
1.989
-0.216
-9.81%
jan 1, 1981
1.695
-0.294
-14.77%
jan 1, 1982
1.744
+0.049
2.87%
jan 1, 1983
1.845
+0.101
5.8%
jan 1, 1984
1.95
+0.105
5.69%
jan 1, 1985
1.884
-0.066
-3.36%
jan 1, 1986
1.739
-0.145
-7.7%
jan 1, 1987
1.761
+0.022
1.27%
jan 1, 1988
1.772
+0.011
0.6%
jan 1, 1989
1.634
-0.138
-7.77%
jan 1, 1990
1.665
+0.031
1.91%
jan 1, 1991
1.165
-0.5
-30.05%
jan 1, 1992
0.873
-0.292
-25.09%
jan 1, 1993
0.385
-0.487
-55.85%
jan 1, 1994
-0.74
-1.126
-292.12%
jan 1, 1995
-0.81
-0.07
9.47%
jan 1, 1996
0.22
+1.03
-127.15%
jan 1, 1997
0.698
+0.478
217.48%
jan 1, 1998
0.676
-0.022
-3.17%
jan 1, 1999
0.746
+0.069
10.26%
jan 1, 2000
0.91
+0.164
22.01%
jan 1, 2001
1.185
+0.276
30.3%
jan 1, 2002
0.943
-0.242
-20.44%
jan 1, 2003
0.915
-0.028
-2.97%
jan 1, 2004
1.043
+0.128
13.95%
jan 1, 2005
1.207
+0.165
15.78%
jan 1, 2006
1.122
-0.085
-7.05%
jan 1, 2007
1.072
-0.05
-4.46%
jan 1, 2008
0.948
-0.124
-11.59%
jan 1, 2009
0.945
-0.003
-0.35%
jan 1, 2010
1.204
+0.26
27.52%
jan 1, 2011
1.247
+0.042
3.5%
jan 1, 2012
1.327
+0.081
6.47%
jan 1, 2013
1.838
+0.51
38.45%
jan 1, 2014
2.21
+0.373
20.29%
jan 1, 2015
2.293
+0.083
3.74%
jan 1, 2016
2.403
+0.11
4.79%
Ranking of countries by current statistics by years


Comments: