29
/
en
AIzaSyAYiBZKx7MnpbEhh9jyipgxe19OcubqV5w
April 1, 2024
192636
Marshall Islands
MHL
true
2
1
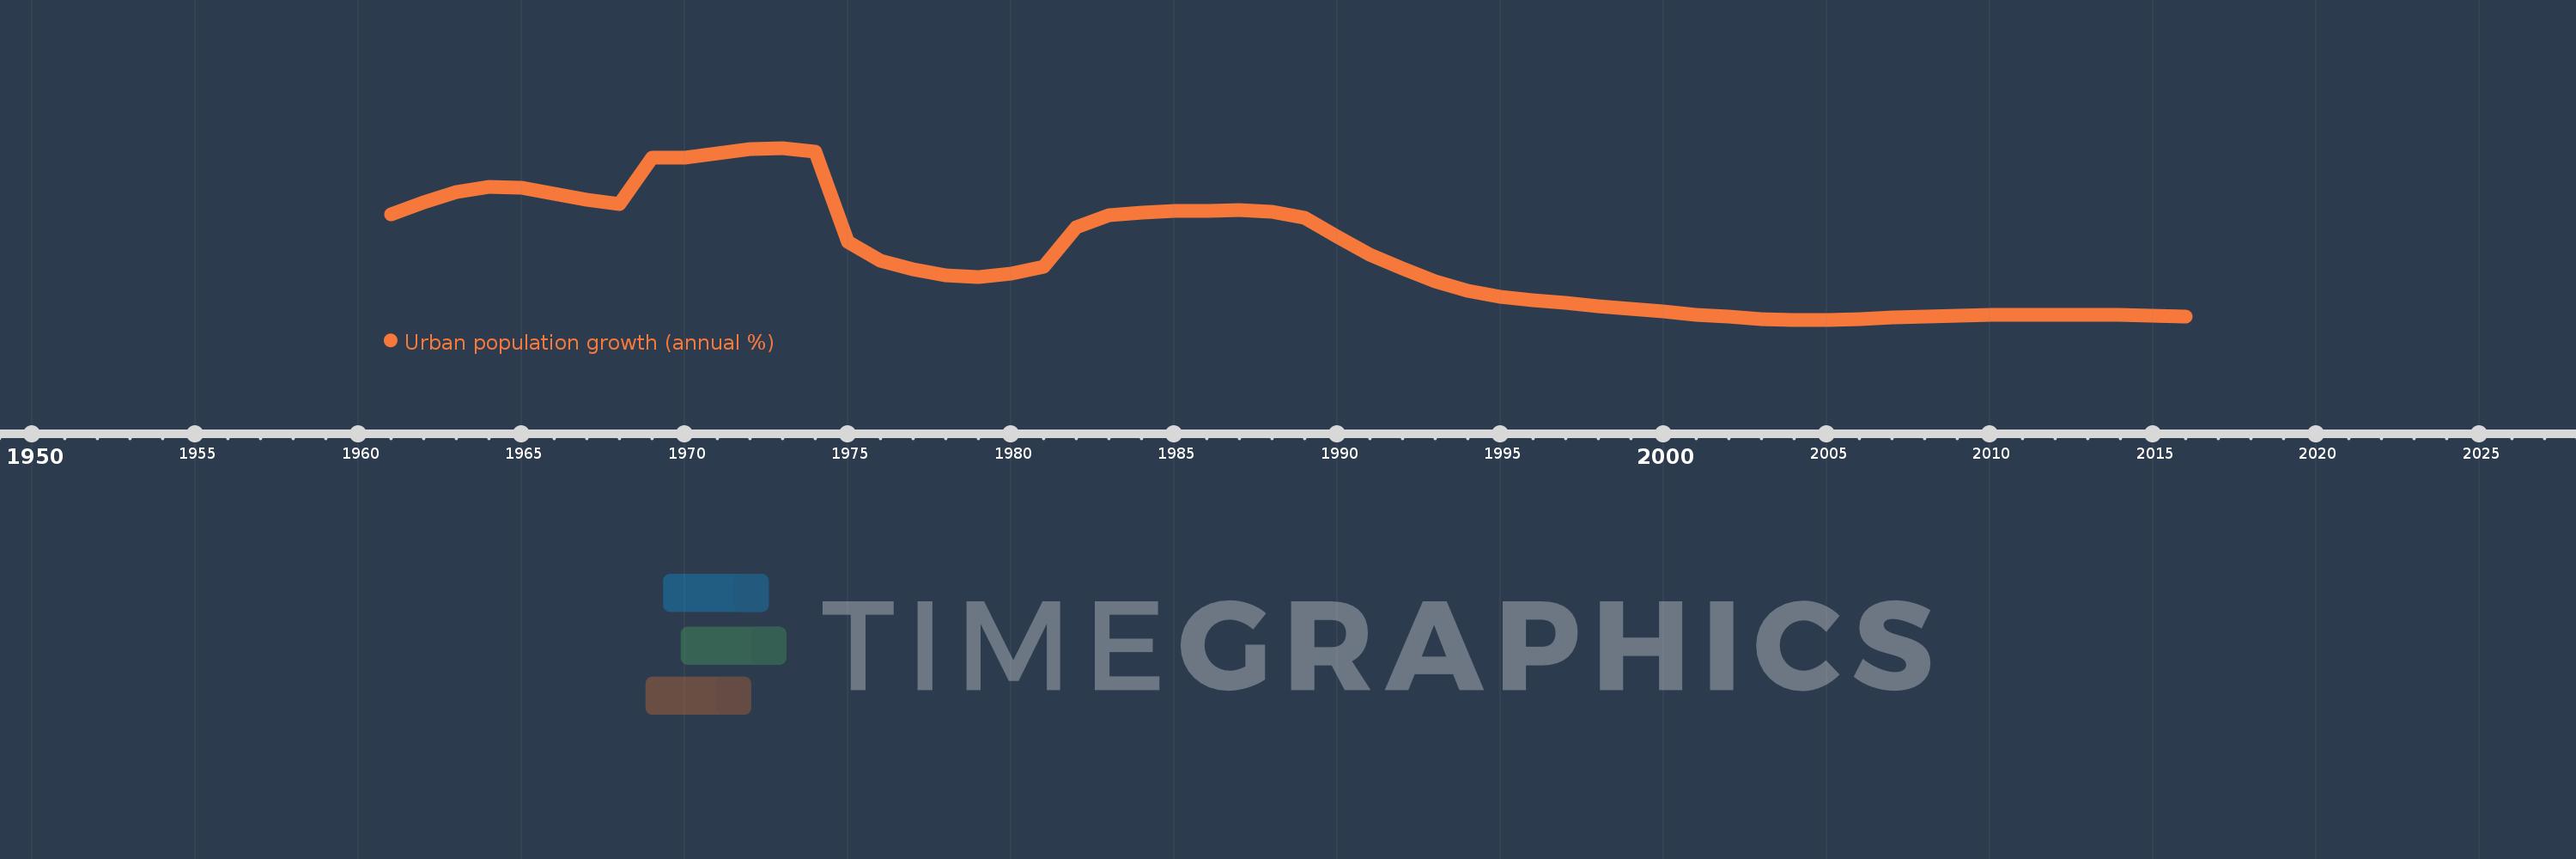
Urban population growth (annual %)
2016,2015,2014,2013,2012,2011,2010,2009,2008,2007,2006,2005,2004,2003,2002,2001,2000,1999,1998,1997,1996,1995,1994,1993,1992,1991,1990,1989,1988,1987,1986,1985,1984,1983,1982,1981,1980,1979,1978,1977,1976,1975,1974,1973,1972,1971,1970,1969,1968,1967,1966,1965,1964,1963,1962,1961
This statistics in other country:
AfghanistanAlbaniaAlgeriaAmerican SamoaAndorraAngolaAntigua and BarbudaArab WorldArgentinaArmeniaArubaAustraliaAustriaAzerbaijanBahamas, TheBahrainBangladeshBarbadosBelarusBelgiumBelizeBeninBermudaBhutanBoliviaBosnia and HerzegovinaBotswanaBrazilBritish Virgin IslandsBrunei DarussalamBulgariaBurkina FasoBurundiCabo VerdeCambodiaCameroonCanadaCaribbean small statesCayman IslandsCentral African RepublicCentral Europe and the BalticsChadChannel IslandsChileChinaColombiaComorosCongo, Dem. Rep.Congo, Rep.Costa RicaCote d'IvoireCroatiaCubaCuracaoCyprusCzech RepublicDenmarkDjiboutiDominicaDominican RepublicEarly-demographic dividendEast Asia & PacificEast Asia & Pacific (excluding high income)East Asia & Pacific (IDA & IBRD countries)EcuadorEgypt, Arab Rep.El SalvadorEquatorial GuineaEritreaEstoniaEthiopiaEuro areaEurope & Central AsiaEurope & Central Asia (excluding high income)Europe & Central Asia (IDA & IBRD countries)European UnionFaroe IslandsFijiFinlandFragile and conflict affected situationsFranceFrench PolynesiaGabonGambia, TheGeorgiaGermanyGhanaGibraltarGreeceGreenlandGrenadaGuamGuatemalaGuineaGuinea-BissauGuyanaHaitiHeavily indebted poor countries (HIPC)High incomeHondurasHong Kong SAR, ChinaHungaryIBRD onlyIcelandIDA & IBRD totalIDA blendIDA onlyIDA totalIndiaIndonesiaIran, Islamic Rep.IraqIrelandIsle of ManIsraelItalyJamaicaJapanJordanKazakhstanKenyaKiribatiKorea, Dem. People’s Rep.Korea, Rep.KuwaitKyrgyz RepublicLao PDRLate-demographic dividendLatin America & Caribbean Latin America & Caribbean (excluding high income)Latin America & the Caribbean (IDA & IBRD countries)LatviaLeast developed countries: UN classificationLebanonLesothoLiberiaLibyaLiechtensteinLithuaniaLow & middle incomeLow incomeLower middle incomeLuxembourgMacao SAR, ChinaMacedonia, FYRMadagascarMalawiMalaysiaMaldivesMaliMaltaMarshall IslandsMauritaniaMauritiusMexicoMicronesia, Fed. Sts.Middle East & North AfricaMiddle East & North Africa (excluding high income)Middle East & North Africa (IDA & IBRD countries)Middle incomeMoldovaMonacoMongoliaMontenegroMoroccoMozambiqueMyanmarNamibiaNauruNepalNetherlandsNew CaledoniaNew ZealandNicaraguaNigerNigeriaNorth AmericaNorthern Mariana IslandsNorwayOECD membersOmanOther small statesPacific island small statesPakistanPalauPanamaPapua New GuineaParaguayPeruPhilippinesPolandPortugalPost-demographic dividendPre-demographic dividendPuerto RicoQatarRomaniaRussian FederationRwandaSamoaSan MarinoSao Tome and PrincipeSaudi ArabiaSenegalSerbiaSeychellesSierra LeoneSingaporeSint Maarten (Dutch part)Slovak RepublicSloveniaSmall statesSolomon IslandsSomaliaSouth AfricaSouth AsiaSouth Asia (IDA & IBRD)South SudanSpainSri LankaSt. Kitts and NevisSt. LuciaSt. Vincent and the GrenadinesSub-Saharan Africa Sub-Saharan Africa (excluding high income)Sub-Saharan Africa (IDA & IBRD countries)SudanSurinameSwazilandSwedenSwitzerlandSyrian Arab RepublicTajikistanTanzaniaThailandTimor-LesteTogoTongaTrinidad and TobagoTunisiaTurkeyTurkmenistanTurks and Caicos IslandsTuvaluUgandaUkraineUnited Arab EmiratesUnited KingdomUnited StatesUpper middle incomeUruguayUzbekistanVanuatuVenezuela, RBVietnamVirgin Islands (U.S.)West Bank and GazaWorldYemen, Rep.ZambiaZimbabwe Timeline:
This timeline shows a graph from 1961 to 2016 of Marshall Islands. No data until 1960. Number of actual observations by date: 56.
Source name:
World Development Indicators
Source organization:
World Bank Staff estimates based on United Nations, World Urbanization Prospects.
Categories, topics:
Climate Change, Urban Development
Last updated:
apr 23, 2017
Indicators value changes by year
At the date of observation
Value
Absolute change
Change from previous value
jan 1, 1961
5.779
+5.779
0.0%
jan 1, 1962
6.402
+0.623
10.79%
jan 1, 1963
6.944
+0.541
8.45%
jan 1, 1964
7.197
+0.254
3.65%
jan 1, 1965
7.165
-0.032
-0.45%
jan 1, 1966
6.862
-0.303
-4.23%
jan 1, 1967
6.549
-0.314
-4.57%
jan 1, 1968
6.313
-0.236
-3.6%
jan 1, 1969
8.698
+2.385
37.78%
jan 1, 1970
8.716
+0.018
0.2%
jan 1, 1971
8.919
+0.203
2.33%
jan 1, 1972
9.146
+0.227
2.55%
jan 1, 1973
9.214
+0.068
0.74%
jan 1, 1974
9.024
-0.191
-2.07%
jan 1, 1975
4.377
-4.646
-51.49%
jan 1, 1976
3.41
-0.967
-22.09%
jan 1, 1977
2.948
-0.462
-13.56%
jan 1, 1978
2.638
-0.31
-10.51%
jan 1, 1979
2.54
-0.098
-3.7%
jan 1, 1980
2.721
+0.18
7.1%
jan 1, 1981
3.082
+0.361
13.26%
jan 1, 1982
5.112
+2.03
65.88%
jan 1, 1983
5.742
+0.631
12.34%
jan 1, 1984
5.878
+0.135
2.35%
jan 1, 1985
5.963
+0.086
1.46%
jan 1, 1986
5.969
+0.006
0.1%
jan 1, 1987
5.991
+0.021
0.36%
jan 1, 1988
5.925
-0.065
-1.09%
jan 1, 1989
5.625
-0.3
-5.06%
jan 1, 1990
4.653
-0.972
-17.28%
jan 1, 1991
3.721
-0.932
-20.03%
jan 1, 1992
2.984
-0.737
-19.81%
jan 1, 1993
2.354
-0.63
-21.12%
jan 1, 1994
1.856
-0.498
-21.15%
jan 1, 1995
1.545
-0.31
-16.72%
jan 1, 1996
1.369
-0.176
-11.4%
jan 1, 1997
1.232
-0.137
-10.03%
jan 1, 1998
1.068
-0.164
-13.32%
jan 1, 1999
0.917
-0.151
-14.1%
jan 1, 2000
0.776
-0.141
-15.36%
jan 1, 2001
0.633
-0.143
-18.46%
jan 1, 2002
0.506
-0.127
-20.01%
jan 1, 2003
0.409
-0.097
-19.16%
jan 1, 2004
0.361
-0.049
-11.9%
jan 1, 2005
0.359
-0.001
-0.36%
jan 1, 2006
0.399
+0.04
11.12%
jan 1, 2007
0.466
+0.067
16.74%
jan 1, 2008
0.524
+0.058
12.38%
jan 1, 2009
0.57
+0.046
8.78%
jan 1, 2010
0.591
+0.021
3.68%
jan 1, 2011
0.601
+0.01
1.68%
jan 1, 2012
0.6
-0.001
-0.15%
jan 1, 2013
0.612
+0.012
2.05%
jan 1, 2014
0.606
-0.006
-1.04%
jan 1, 2015
0.579
-0.027
-4.48%
jan 1, 2016
0.536
-0.042
-7.31%
Ranking of countries by current statistics by years


Comments: