29
/
en
AIzaSyAYiBZKx7MnpbEhh9jyipgxe19OcubqV5w
April 1, 2024
70665
Argentina
ARG
true
2
1
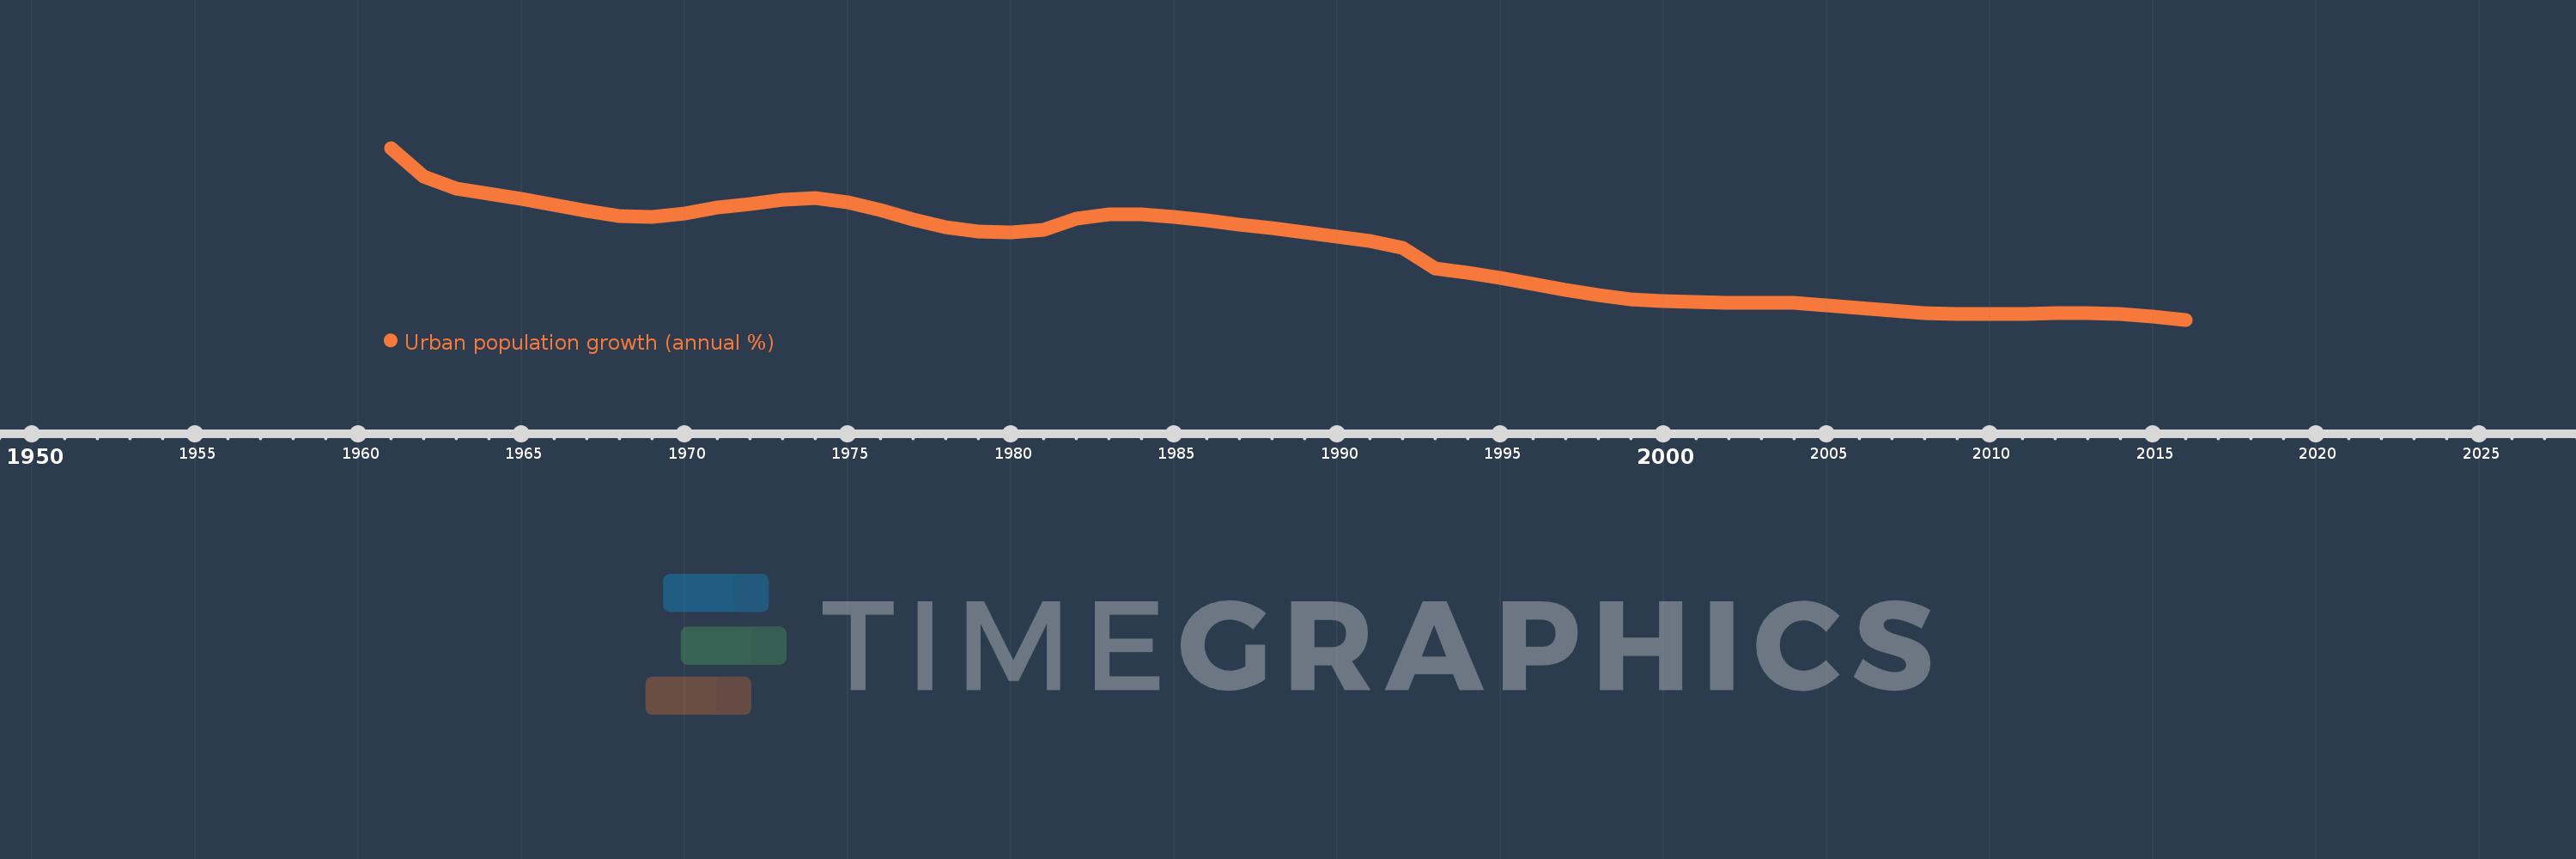
Urban population growth (annual %)
2016,2015,2014,2013,2012,2011,2010,2009,2008,2007,2006,2005,2004,2003,2002,2001,2000,1999,1998,1997,1996,1995,1994,1993,1992,1991,1990,1989,1988,1987,1986,1985,1984,1983,1982,1981,1980,1979,1978,1977,1976,1975,1974,1973,1972,1971,1970,1969,1968,1967,1966,1965,1964,1963,1962,1961
This statistics in other country:
AfghanistanAlbaniaAlgeriaAmerican SamoaAndorraAngolaAntigua and BarbudaArab WorldArgentinaArmeniaArubaAustraliaAustriaAzerbaijanBahamas, TheBahrainBangladeshBarbadosBelarusBelgiumBelizeBeninBermudaBhutanBoliviaBosnia and HerzegovinaBotswanaBrazilBritish Virgin IslandsBrunei DarussalamBulgariaBurkina FasoBurundiCabo VerdeCambodiaCameroonCanadaCaribbean small statesCayman IslandsCentral African RepublicCentral Europe and the BalticsChadChannel IslandsChileChinaColombiaComorosCongo, Dem. Rep.Congo, Rep.Costa RicaCote d'IvoireCroatiaCubaCuracaoCyprusCzech RepublicDenmarkDjiboutiDominicaDominican RepublicEarly-demographic dividendEast Asia & PacificEast Asia & Pacific (excluding high income)East Asia & Pacific (IDA & IBRD countries)EcuadorEgypt, Arab Rep.El SalvadorEquatorial GuineaEritreaEstoniaEthiopiaEuro areaEurope & Central AsiaEurope & Central Asia (excluding high income)Europe & Central Asia (IDA & IBRD countries)European UnionFaroe IslandsFijiFinlandFragile and conflict affected situationsFranceFrench PolynesiaGabonGambia, TheGeorgiaGermanyGhanaGibraltarGreeceGreenlandGrenadaGuamGuatemalaGuineaGuinea-BissauGuyanaHaitiHeavily indebted poor countries (HIPC)High incomeHondurasHong Kong SAR, ChinaHungaryIBRD onlyIcelandIDA & IBRD totalIDA blendIDA onlyIDA totalIndiaIndonesiaIran, Islamic Rep.IraqIrelandIsle of ManIsraelItalyJamaicaJapanJordanKazakhstanKenyaKiribatiKorea, Dem. People’s Rep.Korea, Rep.KuwaitKyrgyz RepublicLao PDRLate-demographic dividendLatin America & Caribbean Latin America & Caribbean (excluding high income)Latin America & the Caribbean (IDA & IBRD countries)LatviaLeast developed countries: UN classificationLebanonLesothoLiberiaLibyaLiechtensteinLithuaniaLow & middle incomeLow incomeLower middle incomeLuxembourgMacao SAR, ChinaMacedonia, FYRMadagascarMalawiMalaysiaMaldivesMaliMaltaMarshall IslandsMauritaniaMauritiusMexicoMicronesia, Fed. Sts.Middle East & North AfricaMiddle East & North Africa (excluding high income)Middle East & North Africa (IDA & IBRD countries)Middle incomeMoldovaMonacoMongoliaMontenegroMoroccoMozambiqueMyanmarNamibiaNauruNepalNetherlandsNew CaledoniaNew ZealandNicaraguaNigerNigeriaNorth AmericaNorthern Mariana IslandsNorwayOECD membersOmanOther small statesPacific island small statesPakistanPalauPanamaPapua New GuineaParaguayPeruPhilippinesPolandPortugalPost-demographic dividendPre-demographic dividendPuerto RicoQatarRomaniaRussian FederationRwandaSamoaSan MarinoSao Tome and PrincipeSaudi ArabiaSenegalSerbiaSeychellesSierra LeoneSingaporeSint Maarten (Dutch part)Slovak RepublicSloveniaSmall statesSolomon IslandsSomaliaSouth AfricaSouth AsiaSouth Asia (IDA & IBRD)South SudanSpainSri LankaSt. Kitts and NevisSt. LuciaSt. Vincent and the GrenadinesSub-Saharan Africa Sub-Saharan Africa (excluding high income)Sub-Saharan Africa (IDA & IBRD countries)SudanSurinameSwazilandSwedenSwitzerlandSyrian Arab RepublicTajikistanTanzaniaThailandTimor-LesteTogoTongaTrinidad and TobagoTunisiaTurkeyTurkmenistanTurks and Caicos IslandsTuvaluUgandaUkraineUnited Arab EmiratesUnited KingdomUnited StatesUpper middle incomeUruguayUzbekistanVanuatuVenezuela, RBVietnamVirgin Islands (U.S.)West Bank and GazaWorldYemen, Rep.ZambiaZimbabwe Timeline:
This timeline shows a graph from 1961 to 2016 of Argentina. No data until 1960. Number of actual observations by date: 56.
Source name:
World Development Indicators
Source organization:
World Bank Staff estimates based on United Nations, World Urbanization Prospects.
Categories, topics:
Climate Change, Urban Development
Last updated:
apr 23, 2017
Indicators value changes by year
At the date of observation
Value
Absolute change
Change from previous value
jan 1, 1961
2.681
+2.681
0.0%
jan 1, 1962
2.427
-0.254
-9.48%
jan 1, 1963
2.323
-0.104
-4.29%
jan 1, 1964
2.28
-0.043
-1.84%
jan 1, 1965
2.232
-0.048
-2.1%
jan 1, 1966
2.179
-0.053
-2.36%
jan 1, 1967
2.127
-0.053
-2.41%
jan 1, 1968
2.082
-0.045
-2.12%
jan 1, 1969
2.073
-0.009
-0.44%
jan 1, 1970
2.102
+0.029
1.42%
jan 1, 1971
2.161
+0.059
2.81%
jan 1, 1972
2.185
+0.024
1.11%
jan 1, 1973
2.226
+0.04
1.85%
jan 1, 1974
2.241
+0.015
0.7%
jan 1, 1975
2.204
-0.037
-1.63%
jan 1, 1976
2.132
-0.073
-3.3%
jan 1, 1977
2.05
-0.081
-3.81%
jan 1, 1978
1.982
-0.069
-3.35%
jan 1, 1979
1.943
-0.039
-1.96%
jan 1, 1980
1.938
-0.005
-0.24%
jan 1, 1981
1.959
+0.021
1.08%
jan 1, 1982
2.057
+0.098
5.0%
jan 1, 1983
2.1
+0.043
2.1%
jan 1, 1984
2.095
-0.006
-0.27%
jan 1, 1985
2.076
-0.018
-0.88%
jan 1, 1986
2.043
-0.033
-1.59%
jan 1, 1987
2.007
-0.036
-1.76%
jan 1, 1988
1.974
-0.033
-1.66%
jan 1, 1989
1.939
-0.034
-1.75%
jan 1, 1990
1.901
-0.038
-1.98%
jan 1, 1991
1.862
-0.039
-2.05%
jan 1, 1992
1.803
-0.059
-3.17%
jan 1, 1993
1.625
-0.178
-9.89%
jan 1, 1994
1.585
-0.04
-2.46%
jan 1, 1995
1.539
-0.045
-2.87%
jan 1, 1996
1.487
-0.052
-3.37%
jan 1, 1997
1.436
-0.052
-3.48%
jan 1, 1998
1.387
-0.049
-3.41%
jan 1, 1999
1.351
-0.036
-2.57%
jan 1, 2000
1.333
-0.018
-1.37%
jan 1, 2001
1.324
-0.008
-0.62%
jan 1, 2002
1.321
-0.004
-0.27%
jan 1, 2003
1.322
+0.001
0.06%
jan 1, 2004
1.316
-0.006
-0.45%
jan 1, 2005
1.299
-0.017
-1.26%
jan 1, 2006
1.276
-0.023
-1.79%
jan 1, 2007
1.252
-0.024
-1.87%
jan 1, 2008
1.232
-0.02
-1.59%
jan 1, 2009
1.221
-0.011
-0.91%
jan 1, 2010
1.218
-0.003
-0.28%
jan 1, 2011
1.223
+0.005
0.42%
jan 1, 2012
1.228
+0.005
0.42%
jan 1, 2013
1.227
0.0
-0.02%
jan 1, 2014
1.219
-0.009
-0.69%
jan 1, 2015
1.199
-0.02
-1.62%
jan 1, 2016
1.171
-0.028
-2.32%
Ranking of countries by current statistics by years


Comments: