29
/
en
AIzaSyAYiBZKx7MnpbEhh9jyipgxe19OcubqV5w
April 1, 2024
32327
Europe & Central Asia (excluding high income)
ECA
false
2
1
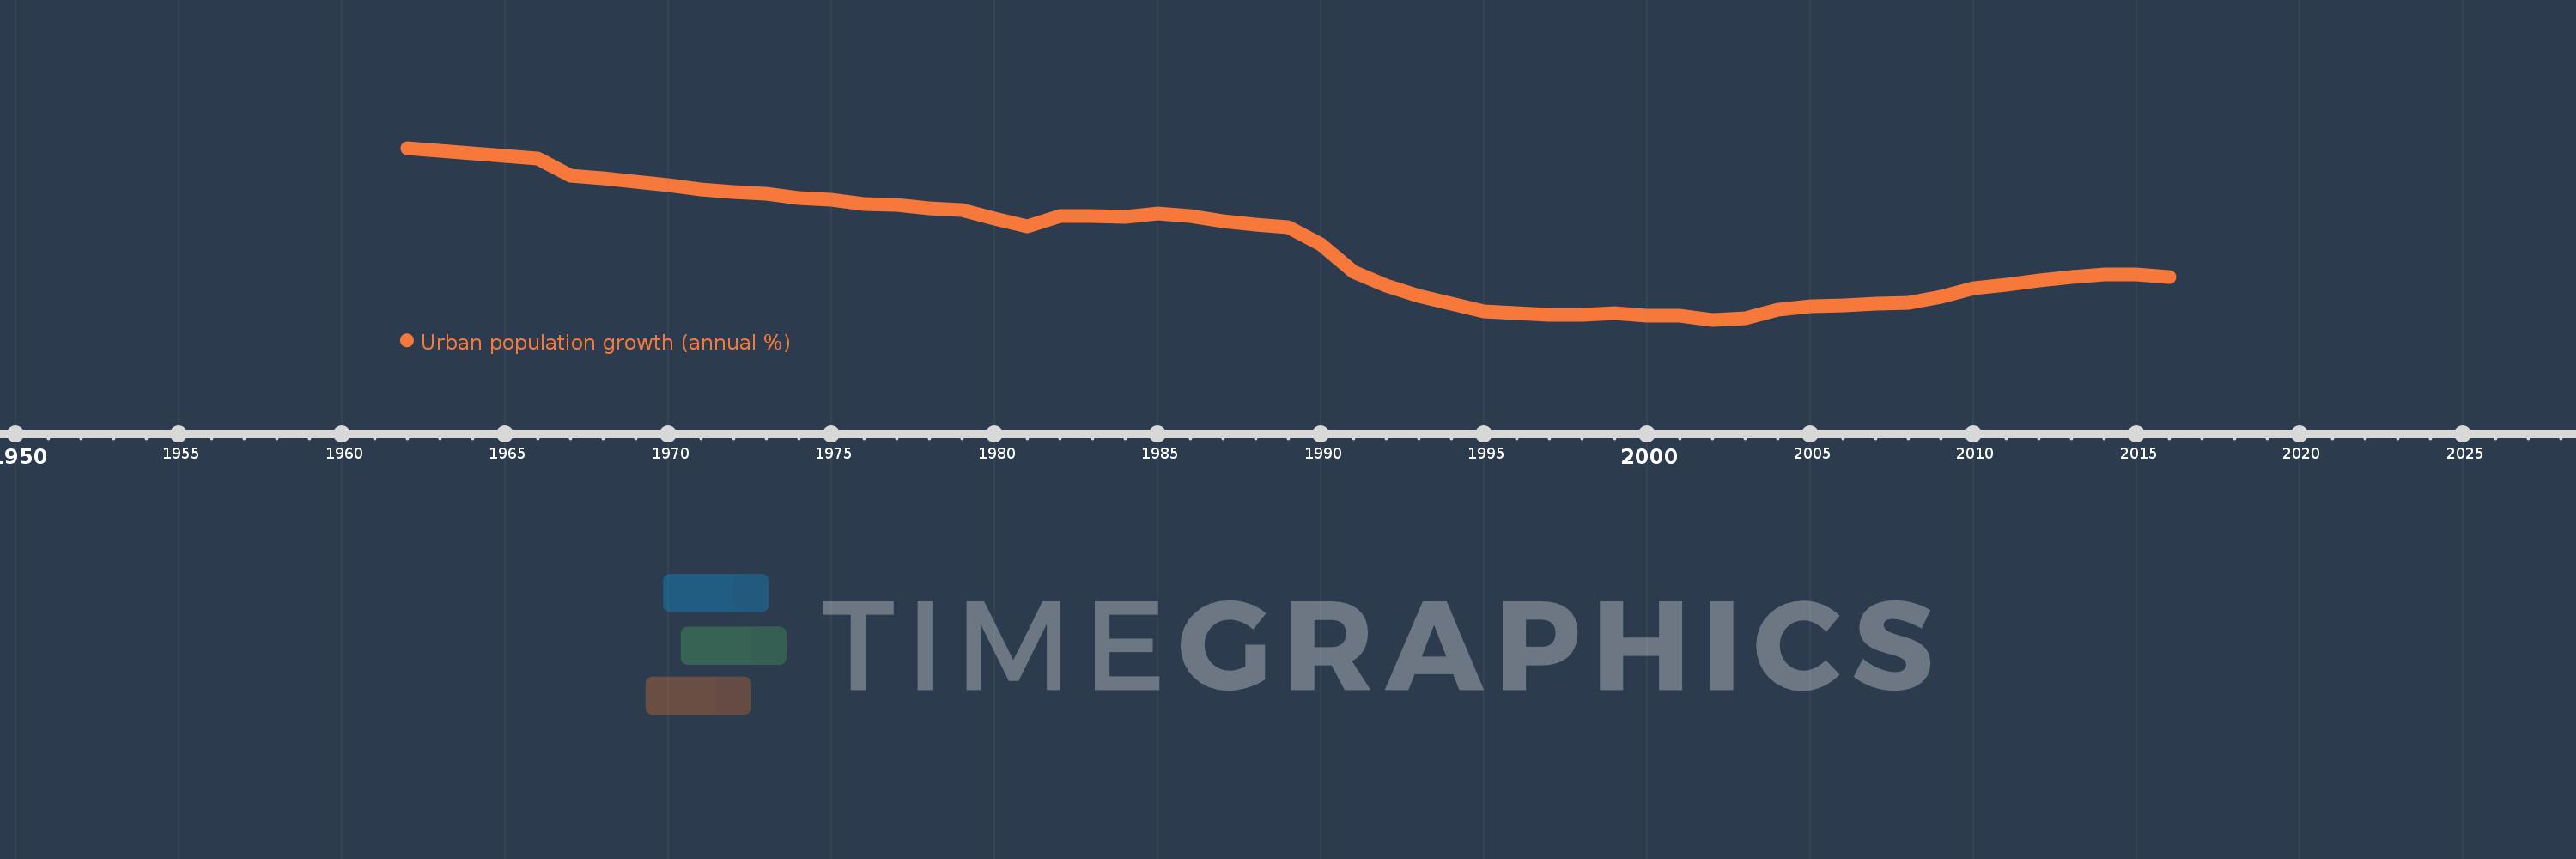
Urban population growth (annual %)
2016,2015,2014,2013,2012,2011,2010,2009,2008,2007,2006,2005,2004,2003,2002,2001,2000,1999,1998,1997,1996,1995,1994,1993,1992,1991,1990,1989,1988,1987,1986,1985,1984,1983,1982,1981,1980,1979,1978,1977,1976,1975,1974,1973,1972,1971,1970,1969,1968,1967,1966,1965,1964,1963,1962
This statistics in other country:
AfghanistanAlbaniaAlgeriaAmerican SamoaAndorraAngolaAntigua and BarbudaArab WorldArgentinaArmeniaArubaAustraliaAustriaAzerbaijanBahamas, TheBahrainBangladeshBarbadosBelarusBelgiumBelizeBeninBermudaBhutanBoliviaBosnia and HerzegovinaBotswanaBrazilBritish Virgin IslandsBrunei DarussalamBulgariaBurkina FasoBurundiCabo VerdeCambodiaCameroonCanadaCaribbean small statesCayman IslandsCentral African RepublicCentral Europe and the BalticsChadChannel IslandsChileChinaColombiaComorosCongo, Dem. Rep.Congo, Rep.Costa RicaCote d'IvoireCroatiaCubaCuracaoCyprusCzech RepublicDenmarkDjiboutiDominicaDominican RepublicEarly-demographic dividendEast Asia & PacificEast Asia & Pacific (excluding high income)East Asia & Pacific (IDA & IBRD countries)EcuadorEgypt, Arab Rep.El SalvadorEquatorial GuineaEritreaEstoniaEthiopiaEuro areaEurope & Central AsiaEurope & Central Asia (excluding high income)Europe & Central Asia (IDA & IBRD countries)European UnionFaroe IslandsFijiFinlandFragile and conflict affected situationsFranceFrench PolynesiaGabonGambia, TheGeorgiaGermanyGhanaGibraltarGreeceGreenlandGrenadaGuamGuatemalaGuineaGuinea-BissauGuyanaHaitiHeavily indebted poor countries (HIPC)High incomeHondurasHong Kong SAR, ChinaHungaryIBRD onlyIcelandIDA & IBRD totalIDA blendIDA onlyIDA totalIndiaIndonesiaIran, Islamic Rep.IraqIrelandIsle of ManIsraelItalyJamaicaJapanJordanKazakhstanKenyaKiribatiKorea, Dem. People’s Rep.Korea, Rep.KuwaitKyrgyz RepublicLao PDRLate-demographic dividendLatin America & Caribbean Latin America & Caribbean (excluding high income)Latin America & the Caribbean (IDA & IBRD countries)LatviaLeast developed countries: UN classificationLebanonLesothoLiberiaLibyaLiechtensteinLithuaniaLow & middle incomeLow incomeLower middle incomeLuxembourgMacao SAR, ChinaMacedonia, FYRMadagascarMalawiMalaysiaMaldivesMaliMaltaMarshall IslandsMauritaniaMauritiusMexicoMicronesia, Fed. Sts.Middle East & North AfricaMiddle East & North Africa (excluding high income)Middle East & North Africa (IDA & IBRD countries)Middle incomeMoldovaMonacoMongoliaMontenegroMoroccoMozambiqueMyanmarNamibiaNauruNepalNetherlandsNew CaledoniaNew ZealandNicaraguaNigerNigeriaNorth AmericaNorthern Mariana IslandsNorwayOECD membersOmanOther small statesPacific island small statesPakistanPalauPanamaPapua New GuineaParaguayPeruPhilippinesPolandPortugalPost-demographic dividendPre-demographic dividendPuerto RicoQatarRomaniaRussian FederationRwandaSamoaSan MarinoSao Tome and PrincipeSaudi ArabiaSenegalSerbiaSeychellesSierra LeoneSingaporeSint Maarten (Dutch part)Slovak RepublicSloveniaSmall statesSolomon IslandsSomaliaSouth AfricaSouth AsiaSouth Asia (IDA & IBRD)South SudanSpainSri LankaSt. Kitts and NevisSt. LuciaSt. Vincent and the GrenadinesSub-Saharan Africa Sub-Saharan Africa (excluding high income)Sub-Saharan Africa (IDA & IBRD countries)SudanSurinameSwazilandSwedenSwitzerlandSyrian Arab RepublicTajikistanTanzaniaThailandTimor-LesteTogoTongaTrinidad and TobagoTunisiaTurkeyTurkmenistanTurks and Caicos IslandsTuvaluUgandaUkraineUnited Arab EmiratesUnited KingdomUnited StatesUpper middle incomeUruguayUzbekistanVanuatuVenezuela, RBVietnamVirgin Islands (U.S.)West Bank and GazaWorldYemen, Rep.ZambiaZimbabwe Timeline:
This timeline shows a graph from 1962 to 2016 of Europe & Central Asia (excluding high income). No data until 1961. Number of actual observations by date: 55.
Source name:
World Development Indicators
Source organization:
World Bank Staff estimates based on United Nations, World Urbanization Prospects.
Categories, topics:
Climate Change, Urban Development
Last updated:
apr 23, 2017
Indicators value changes by year
At the date of observation
Value
Absolute change
Change from previous value
jan 1, 1962
3.249
+3.249
0.0%
jan 1, 1963
3.199
-0.05
-1.54%
jan 1, 1964
3.152
-0.048
-1.49%
jan 1, 1965
3.093
-0.059
-1.87%
jan 1, 1966
3.048
-0.045
-1.45%
jan 1, 1967
2.724
-0.323
-10.61%
jan 1, 1968
2.676
-0.048
-1.76%
jan 1, 1969
2.613
-0.063
-2.37%
jan 1, 1970
2.557
-0.056
-2.13%
jan 1, 1971
2.467
-0.09
-3.54%
jan 1, 1972
2.415
-0.052
-2.11%
jan 1, 1973
2.393
-0.021
-0.88%
jan 1, 1974
2.312
-0.082
-3.42%
jan 1, 1975
2.276
-0.035
-1.52%
jan 1, 1976
2.2
-0.077
-3.36%
jan 1, 1977
2.177
-0.023
-1.04%
jan 1, 1978
2.112
-0.065
-2.98%
jan 1, 1979
2.078
-0.034
-1.61%
jan 1, 1980
1.92
-0.158
-7.6%
jan 1, 1981
1.782
-0.138
-7.16%
jan 1, 1982
1.972
+0.189
10.62%
jan 1, 1983
1.977
+0.005
0.27%
jan 1, 1984
1.957
-0.02
-1.02%
jan 1, 1985
2.024
+0.067
3.43%
jan 1, 1986
1.979
-0.045
-2.23%
jan 1, 1987
1.869
-0.11
-5.56%
jan 1, 1988
1.808
-0.06
-3.24%
jan 1, 1989
1.755
-0.053
-2.94%
jan 1, 1990
1.447
-0.308
-17.58%
jan 1, 1991
0.927
-0.52
-35.94%
jan 1, 1992
0.67
-0.257
-27.73%
jan 1, 1993
0.471
-0.199
-29.7%
jan 1, 1994
0.325
-0.146
-30.94%
jan 1, 1995
0.178
-0.147
-45.27%
jan 1, 1996
0.149
-0.028
-16.01%
jan 1, 1997
0.113
-0.036
-24.23%
jan 1, 1998
0.124
+0.01
9.19%
jan 1, 1999
0.147
+0.023
18.75%
jan 1, 2000
0.106
-0.041
-27.99%
jan 1, 2001
0.102
-0.004
-3.42%
jan 1, 2002
0.028
-0.074
-72.29%
jan 1, 2003
0.054
+0.026
90.87%
jan 1, 2004
0.218
+0.164
303.94%
jan 1, 2005
0.28
+0.062
28.37%
jan 1, 2006
0.298
+0.017
6.22%
jan 1, 2007
0.327
+0.029
9.83%
jan 1, 2008
0.341
+0.014
4.31%
jan 1, 2009
0.457
+0.116
34.0%
jan 1, 2010
0.626
+0.169
37.04%
jan 1, 2011
0.687
+0.061
9.8%
jan 1, 2012
0.758
+0.071
10.34%
jan 1, 2013
0.822
+0.064
8.42%
jan 1, 2014
0.881
+0.059
7.2%
jan 1, 2015
0.877
-0.004
-0.49%
jan 1, 2016
0.828
-0.049
-5.62%
Ranking of countries by current statistics by years


Comments: