29
/
en
AIzaSyAYiBZKx7MnpbEhh9jyipgxe19OcubqV5w
April 1, 2024
154144
Iceland
ISL
true
2
1
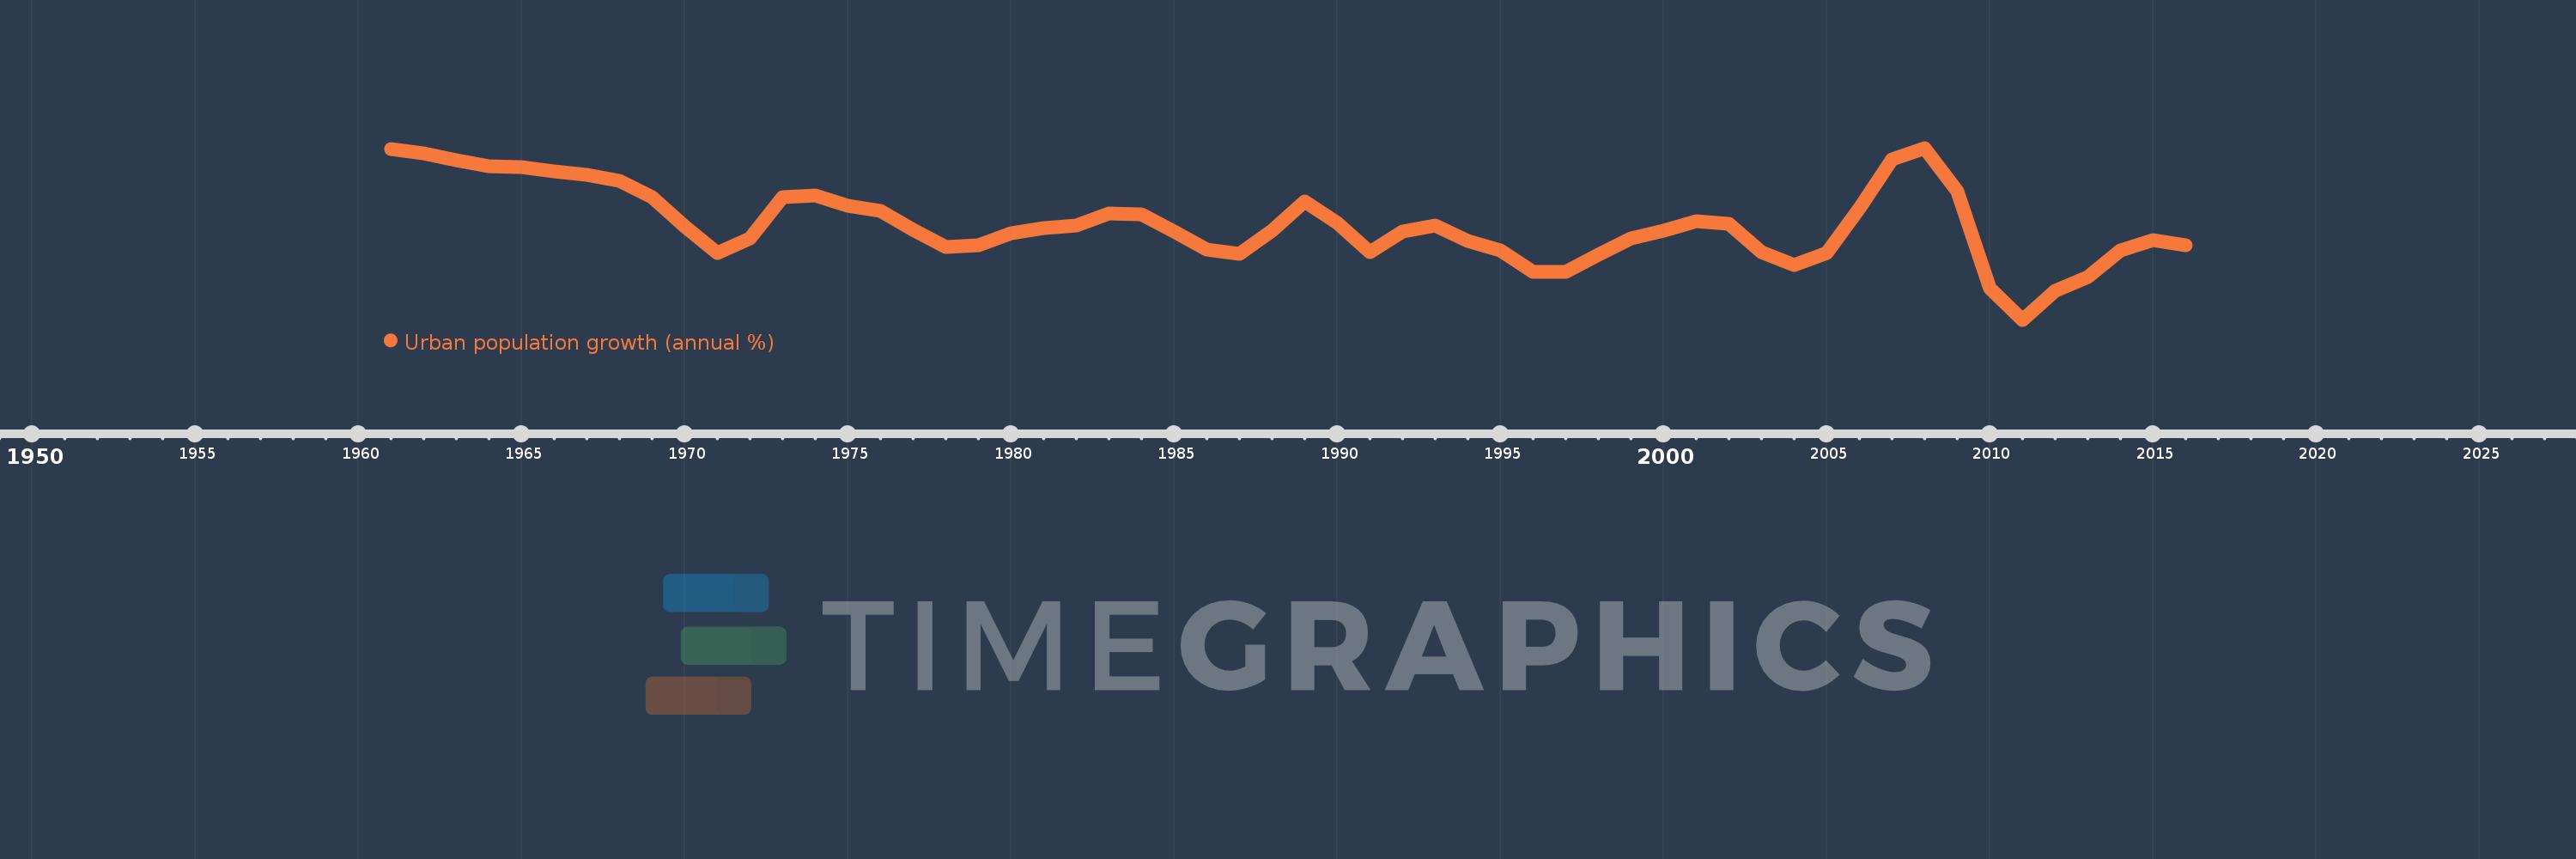
Urban population growth (annual %)
2016,2015,2014,2013,2012,2011,2010,2009,2008,2007,2006,2005,2004,2003,2002,2001,2000,1999,1998,1997,1996,1995,1994,1993,1992,1991,1990,1989,1988,1987,1986,1985,1984,1983,1982,1981,1980,1979,1978,1977,1976,1975,1974,1973,1972,1971,1970,1969,1968,1967,1966,1965,1964,1963,1962,1961
This statistics in other country:
AfghanistanAlbaniaAlgeriaAmerican SamoaAndorraAngolaAntigua and BarbudaArab WorldArgentinaArmeniaArubaAustraliaAustriaAzerbaijanBahamas, TheBahrainBangladeshBarbadosBelarusBelgiumBelizeBeninBermudaBhutanBoliviaBosnia and HerzegovinaBotswanaBrazilBritish Virgin IslandsBrunei DarussalamBulgariaBurkina FasoBurundiCabo VerdeCambodiaCameroonCanadaCaribbean small statesCayman IslandsCentral African RepublicCentral Europe and the BalticsChadChannel IslandsChileChinaColombiaComorosCongo, Dem. Rep.Congo, Rep.Costa RicaCote d'IvoireCroatiaCubaCuracaoCyprusCzech RepublicDenmarkDjiboutiDominicaDominican RepublicEarly-demographic dividendEast Asia & PacificEast Asia & Pacific (excluding high income)East Asia & Pacific (IDA & IBRD countries)EcuadorEgypt, Arab Rep.El SalvadorEquatorial GuineaEritreaEstoniaEthiopiaEuro areaEurope & Central AsiaEurope & Central Asia (excluding high income)Europe & Central Asia (IDA & IBRD countries)European UnionFaroe IslandsFijiFinlandFragile and conflict affected situationsFranceFrench PolynesiaGabonGambia, TheGeorgiaGermanyGhanaGibraltarGreeceGreenlandGrenadaGuamGuatemalaGuineaGuinea-BissauGuyanaHaitiHeavily indebted poor countries (HIPC)High incomeHondurasHong Kong SAR, ChinaHungaryIBRD onlyIcelandIDA & IBRD totalIDA blendIDA onlyIDA totalIndiaIndonesiaIran, Islamic Rep.IraqIrelandIsle of ManIsraelItalyJamaicaJapanJordanKazakhstanKenyaKiribatiKorea, Dem. People’s Rep.Korea, Rep.KuwaitKyrgyz RepublicLao PDRLate-demographic dividendLatin America & Caribbean Latin America & Caribbean (excluding high income)Latin America & the Caribbean (IDA & IBRD countries)LatviaLeast developed countries: UN classificationLebanonLesothoLiberiaLibyaLiechtensteinLithuaniaLow & middle incomeLow incomeLower middle incomeLuxembourgMacao SAR, ChinaMacedonia, FYRMadagascarMalawiMalaysiaMaldivesMaliMaltaMarshall IslandsMauritaniaMauritiusMexicoMicronesia, Fed. Sts.Middle East & North AfricaMiddle East & North Africa (excluding high income)Middle East & North Africa (IDA & IBRD countries)Middle incomeMoldovaMonacoMongoliaMontenegroMoroccoMozambiqueMyanmarNamibiaNauruNepalNetherlandsNew CaledoniaNew ZealandNicaraguaNigerNigeriaNorth AmericaNorthern Mariana IslandsNorwayOECD membersOmanOther small statesPacific island small statesPakistanPalauPanamaPapua New GuineaParaguayPeruPhilippinesPolandPortugalPost-demographic dividendPre-demographic dividendPuerto RicoQatarRomaniaRussian FederationRwandaSamoaSan MarinoSao Tome and PrincipeSaudi ArabiaSenegalSerbiaSeychellesSierra LeoneSingaporeSint Maarten (Dutch part)Slovak RepublicSloveniaSmall statesSolomon IslandsSomaliaSouth AfricaSouth AsiaSouth Asia (IDA & IBRD)South SudanSpainSri LankaSt. Kitts and NevisSt. LuciaSt. Vincent and the GrenadinesSub-Saharan Africa Sub-Saharan Africa (excluding high income)Sub-Saharan Africa (IDA & IBRD countries)SudanSurinameSwazilandSwedenSwitzerlandSyrian Arab RepublicTajikistanTanzaniaThailandTimor-LesteTogoTongaTrinidad and TobagoTunisiaTurkeyTurkmenistanTurks and Caicos IslandsTuvaluUgandaUkraineUnited Arab EmiratesUnited KingdomUnited StatesUpper middle incomeUruguayUzbekistanVanuatuVenezuela, RBVietnamVirgin Islands (U.S.)West Bank and GazaWorldYemen, Rep.ZambiaZimbabwe Timeline:
This timeline shows a graph from 1961 to 2016 of Iceland. No data until 1960. Number of actual observations by date: 56.
Source name:
World Development Indicators
Source organization:
World Bank Staff estimates based on United Nations, World Urbanization Prospects.
Categories, topics:
Climate Change, Urban Development
Last updated:
apr 23, 2017
Indicators value changes by year
Minimum:
-0.023
jan 1, 2011
At the date of observation
Value
Absolute change
Change from previous value
jan 1, 1961
2.64
+2.64
0.0%
jan 1, 1962
2.573
-0.067
-2.52%
jan 1, 1963
2.463
-0.11
-4.29%
jan 1, 1964
2.373
-0.089
-3.63%
jan 1, 1965
2.357
-0.016
-0.69%
jan 1, 1966
2.295
-0.062
-2.62%
jan 1, 1967
2.242
-0.053
-2.32%
jan 1, 1968
2.149
-0.093
-4.15%
jan 1, 1969
1.888
-0.261
-12.15%
jan 1, 1970
1.434
-0.453
-24.01%
jan 1, 1971
1.017
-0.418
-29.11%
jan 1, 1972
1.242
+0.226
22.19%
jan 1, 1973
1.886
+0.644
51.8%
jan 1, 1974
1.921
+0.035
1.84%
jan 1, 1975
1.755
-0.165
-8.61%
jan 1, 1976
1.671
-0.085
-4.83%
jan 1, 1977
1.376
-0.294
-17.62%
jan 1, 1978
1.116
-0.26
-18.89%
jan 1, 1979
1.144
+0.028
2.51%
jan 1, 1980
1.332
+0.188
16.45%
jan 1, 1981
1.405
+0.073
5.47%
jan 1, 1982
1.449
+0.044
3.11%
jan 1, 1983
1.638
+0.189
13.04%
jan 1, 1984
1.618
-0.02
-1.21%
jan 1, 1985
1.352
-0.266
-16.45%
jan 1, 1986
1.068
-0.284
-21.01%
jan 1, 1987
1.007
-0.061
-5.69%
jan 1, 1988
1.363
+0.356
35.34%
jan 1, 1989
1.829
+0.466
34.16%
jan 1, 1990
1.493
-0.336
-18.37%
jan 1, 1991
1.027
-0.466
-31.21%
jan 1, 1992
1.359
+0.332
32.35%
jan 1, 1993
1.454
+0.095
6.98%
jan 1, 1994
1.209
-0.245
-16.87%
jan 1, 1995
1.056
-0.153
-12.64%
jan 1, 1996
0.728
-0.328
-31.06%
jan 1, 1997
0.722
-0.006
-0.83%
jan 1, 1998
0.996
+0.274
38.0%
jan 1, 1999
1.246
+0.25
25.05%
jan 1, 2000
1.367
+0.122
9.75%
jan 1, 2001
1.514
+0.147
10.73%
jan 1, 2002
1.471
-0.043
-2.84%
jan 1, 2003
1.033
-0.438
-29.79%
jan 1, 2004
0.829
-0.204
-19.71%
jan 1, 2005
1.013
+0.183
22.08%
jan 1, 2006
1.715
+0.702
69.36%
jan 1, 2007
2.479
+0.764
44.53%
jan 1, 2008
2.658
+0.179
7.24%
jan 1, 2009
1.985
-0.673
-25.33%
jan 1, 2010
0.465
-1.519
-76.55%
jan 1, 2011
-0.023
-0.489
-104.98%
jan 1, 2012
0.423
+0.446
-1.93K%
jan 1, 2013
0.645
+0.222
52.51%
jan 1, 2014
1.054
+0.409
63.46%
jan 1, 2015
1.219
+0.165
15.61%
jan 1, 2016
1.145
-0.073
-6.02%
Ranking of countries by current statistics by years


Comments: