29
/
en
AIzaSyAYiBZKx7MnpbEhh9jyipgxe19OcubqV5w
April 1, 2024
169561
Korea, Dem. People’s Rep.
PRK
true
2
1
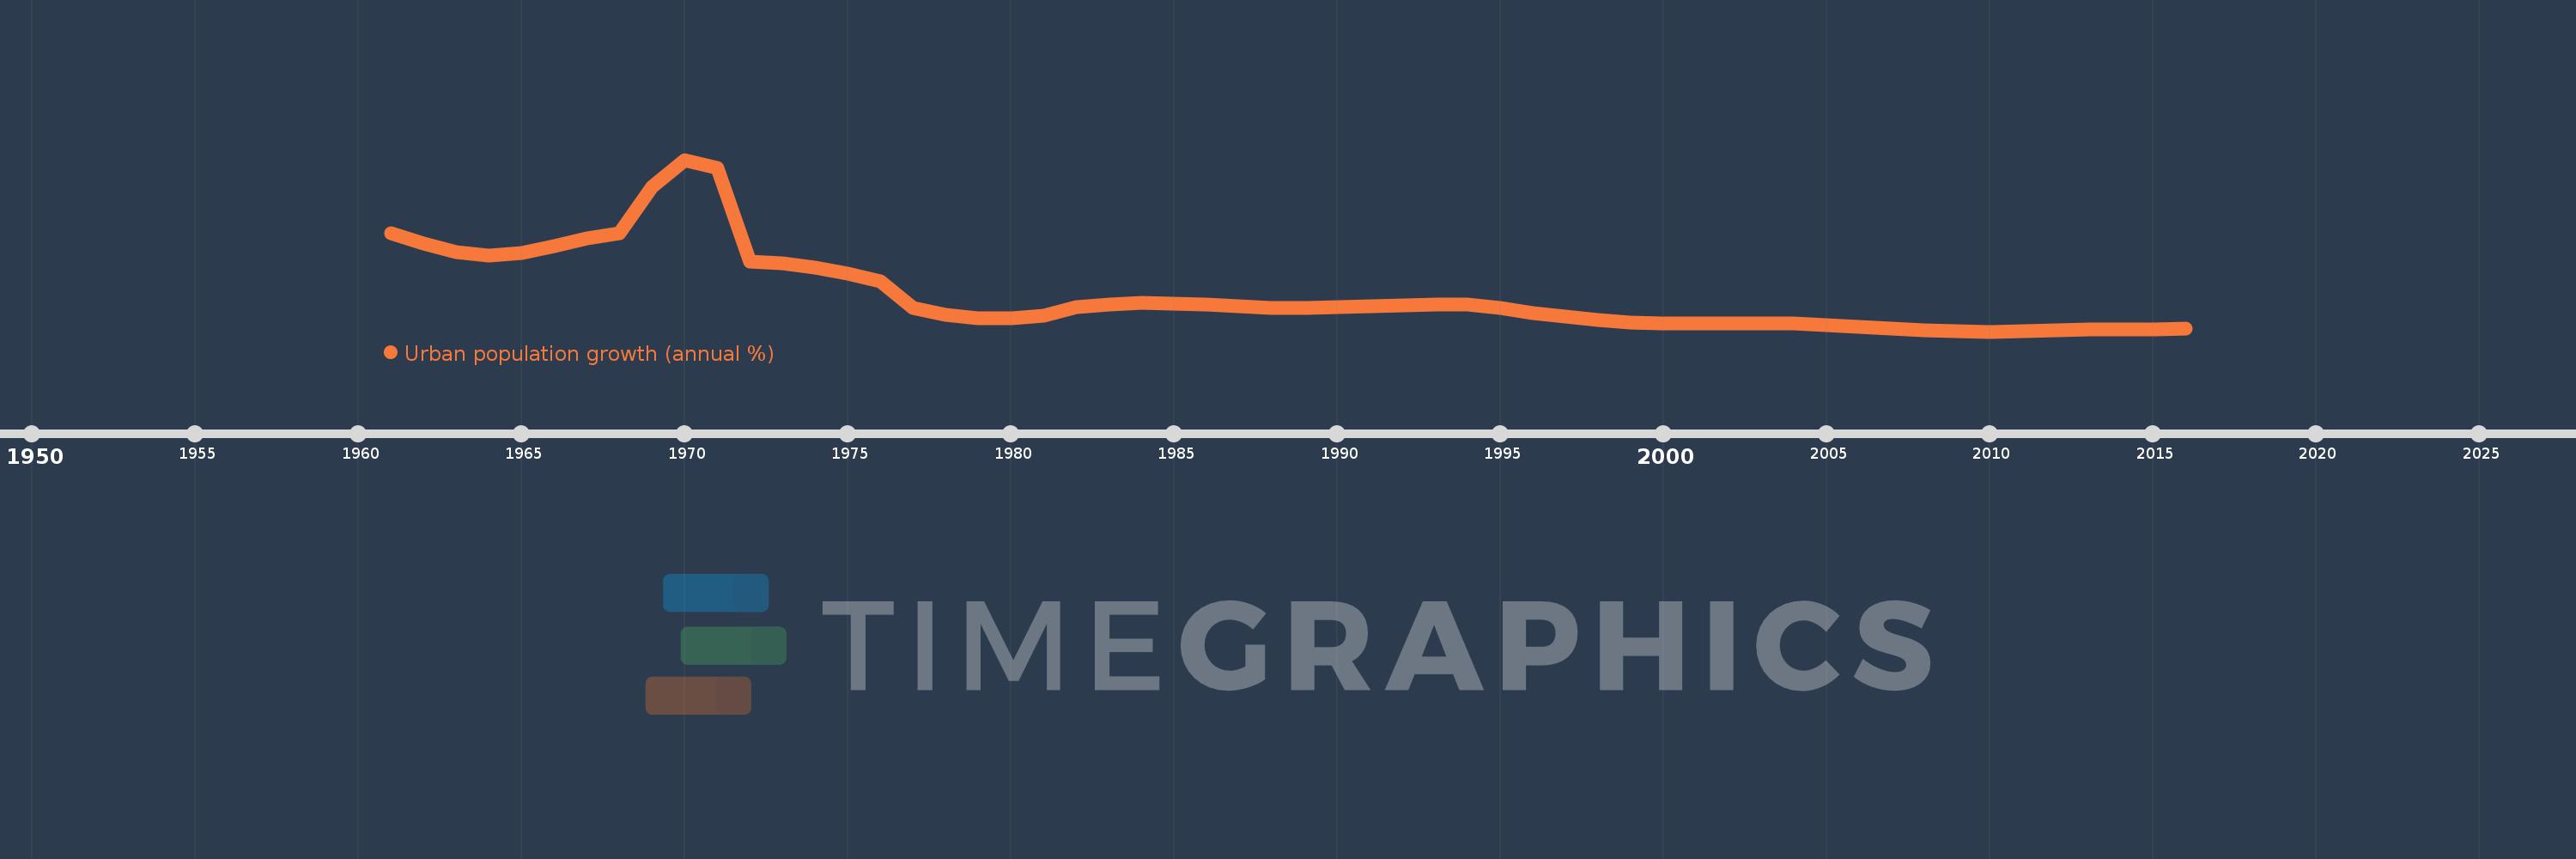
Urban population growth (annual %)
2016,2015,2014,2013,2012,2011,2010,2009,2008,2007,2006,2005,2004,2003,2002,2001,2000,1999,1998,1997,1996,1995,1994,1993,1992,1991,1990,1989,1988,1987,1986,1985,1984,1983,1982,1981,1980,1979,1978,1977,1976,1975,1974,1973,1972,1971,1970,1969,1968,1967,1966,1965,1964,1963,1962,1961
This statistics in other country:
AfghanistanAlbaniaAlgeriaAmerican SamoaAndorraAngolaAntigua and BarbudaArab WorldArgentinaArmeniaArubaAustraliaAustriaAzerbaijanBahamas, TheBahrainBangladeshBarbadosBelarusBelgiumBelizeBeninBermudaBhutanBoliviaBosnia and HerzegovinaBotswanaBrazilBritish Virgin IslandsBrunei DarussalamBulgariaBurkina FasoBurundiCabo VerdeCambodiaCameroonCanadaCaribbean small statesCayman IslandsCentral African RepublicCentral Europe and the BalticsChadChannel IslandsChileChinaColombiaComorosCongo, Dem. Rep.Congo, Rep.Costa RicaCote d'IvoireCroatiaCubaCuracaoCyprusCzech RepublicDenmarkDjiboutiDominicaDominican RepublicEarly-demographic dividendEast Asia & PacificEast Asia & Pacific (excluding high income)East Asia & Pacific (IDA & IBRD countries)EcuadorEgypt, Arab Rep.El SalvadorEquatorial GuineaEritreaEstoniaEthiopiaEuro areaEurope & Central AsiaEurope & Central Asia (excluding high income)Europe & Central Asia (IDA & IBRD countries)European UnionFaroe IslandsFijiFinlandFragile and conflict affected situationsFranceFrench PolynesiaGabonGambia, TheGeorgiaGermanyGhanaGibraltarGreeceGreenlandGrenadaGuamGuatemalaGuineaGuinea-BissauGuyanaHaitiHeavily indebted poor countries (HIPC)High incomeHondurasHong Kong SAR, ChinaHungaryIBRD onlyIcelandIDA & IBRD totalIDA blendIDA onlyIDA totalIndiaIndonesiaIran, Islamic Rep.IraqIrelandIsle of ManIsraelItalyJamaicaJapanJordanKazakhstanKenyaKiribatiKorea, Dem. People’s Rep.Korea, Rep.KuwaitKyrgyz RepublicLao PDRLate-demographic dividendLatin America & Caribbean Latin America & Caribbean (excluding high income)Latin America & the Caribbean (IDA & IBRD countries)LatviaLeast developed countries: UN classificationLebanonLesothoLiberiaLibyaLiechtensteinLithuaniaLow & middle incomeLow incomeLower middle incomeLuxembourgMacao SAR, ChinaMacedonia, FYRMadagascarMalawiMalaysiaMaldivesMaliMaltaMarshall IslandsMauritaniaMauritiusMexicoMicronesia, Fed. Sts.Middle East & North AfricaMiddle East & North Africa (excluding high income)Middle East & North Africa (IDA & IBRD countries)Middle incomeMoldovaMonacoMongoliaMontenegroMoroccoMozambiqueMyanmarNamibiaNauruNepalNetherlandsNew CaledoniaNew ZealandNicaraguaNigerNigeriaNorth AmericaNorthern Mariana IslandsNorwayOECD membersOmanOther small statesPacific island small statesPakistanPalauPanamaPapua New GuineaParaguayPeruPhilippinesPolandPortugalPost-demographic dividendPre-demographic dividendPuerto RicoQatarRomaniaRussian FederationRwandaSamoaSan MarinoSao Tome and PrincipeSaudi ArabiaSenegalSerbiaSeychellesSierra LeoneSingaporeSint Maarten (Dutch part)Slovak RepublicSloveniaSmall statesSolomon IslandsSomaliaSouth AfricaSouth AsiaSouth Asia (IDA & IBRD)South SudanSpainSri LankaSt. Kitts and NevisSt. LuciaSt. Vincent and the GrenadinesSub-Saharan Africa Sub-Saharan Africa (excluding high income)Sub-Saharan Africa (IDA & IBRD countries)SudanSurinameSwazilandSwedenSwitzerlandSyrian Arab RepublicTajikistanTanzaniaThailandTimor-LesteTogoTongaTrinidad and TobagoTunisiaTurkeyTurkmenistanTurks and Caicos IslandsTuvaluUgandaUkraineUnited Arab EmiratesUnited KingdomUnited StatesUpper middle incomeUruguayUzbekistanVanuatuVenezuela, RBVietnamVirgin Islands (U.S.)West Bank and GazaWorldYemen, Rep.ZambiaZimbabwe Timeline:
This timeline shows a graph from 1961 to 2016 of Korea, Dem. People’s Rep.. No data until 1960. Number of actual observations by date: 56.
Source name:
World Development Indicators
Source organization:
World Bank Staff estimates based on United Nations, World Urbanization Prospects.
Categories, topics:
Climate Change, Urban Development
Last updated:
apr 23, 2017
Indicators value changes by year
At the date of observation
Value
Absolute change
Change from previous value
jan 1, 1961
4.905
+4.905
0.0%
jan 1, 1962
4.468
-0.437
-8.91%
jan 1, 1963
4.09
-0.378
-8.46%
jan 1, 1964
3.918
-0.172
-4.21%
jan 1, 1965
4.043
+0.125
3.2%
jan 1, 1966
4.353
+0.31
7.67%
jan 1, 1967
4.675
+0.321
7.38%
jan 1, 1968
4.879
+0.204
4.37%
jan 1, 1969
6.903
+2.024
41.49%
jan 1, 1970
8.064
+1.161
16.82%
jan 1, 1971
7.722
-0.342
-4.24%
jan 1, 1972
3.673
-4.049
-52.43%
jan 1, 1973
3.593
-0.08
-2.18%
jan 1, 1974
3.421
-0.172
-4.8%
jan 1, 1975
3.155
-0.266
-7.77%
jan 1, 1976
2.834
-0.321
-10.16%
jan 1, 1977
1.681
-1.153
-40.68%
jan 1, 1978
1.391
-0.291
-17.29%
jan 1, 1979
1.226
-0.165
-11.84%
jan 1, 1980
1.23
+0.004
0.3%
jan 1, 1981
1.35
+0.12
9.76%
jan 1, 1982
1.697
+0.347
25.73%
jan 1, 1983
1.814
+0.117
6.91%
jan 1, 1984
1.88
+0.066
3.63%
jan 1, 1985
1.874
-0.006
-0.32%
jan 1, 1986
1.816
-0.058
-3.11%
jan 1, 1987
1.741
-0.075
-4.11%
jan 1, 1988
1.691
-0.05
-2.87%
jan 1, 1989
1.672
-0.019
-1.12%
jan 1, 1990
1.697
+0.024
1.46%
jan 1, 1991
1.745
+0.049
2.87%
jan 1, 1992
1.803
+0.058
3.33%
jan 1, 1993
1.838
+0.035
1.94%
jan 1, 1994
1.813
-0.026
-1.4%
jan 1, 1995
1.657
-0.156
-8.61%
jan 1, 1996
1.453
-0.204
-12.31%
jan 1, 1997
1.289
-0.164
-11.28%
jan 1, 1998
1.147
-0.142
-10.98%
jan 1, 1999
1.047
-0.1
-8.73%
jan 1, 2000
1.006
-0.041
-3.93%
jan 1, 2001
1.004
-0.002
-0.19%
jan 1, 2002
1.019
+0.015
1.45%
jan 1, 2003
1.017
-0.002
-0.19%
jan 1, 2004
0.992
-0.024
-2.41%
jan 1, 2005
0.94
-0.052
-5.28%
jan 1, 2006
0.864
-0.076
-8.07%
jan 1, 2007
0.787
-0.077
-8.87%
jan 1, 2008
0.721
-0.066
-8.42%
jan 1, 2009
0.675
-0.046
-6.32%
jan 1, 2010
0.656
-0.019
-2.84%
jan 1, 2011
0.68
+0.023
3.55%
jan 1, 2012
0.709
+0.029
4.26%
jan 1, 2013
0.733
+0.025
3.48%
jan 1, 2014
0.753
+0.02
2.68%
jan 1, 2015
0.766
+0.013
1.72%
jan 1, 2016
0.775
+0.01
1.26%
Ranking of countries by current statistics by years


Comments: