29
/
en
AIzaSyAYiBZKx7MnpbEhh9jyipgxe19OcubqV5w
April 1, 2024
231876
Rwanda
RWA
true
2
1
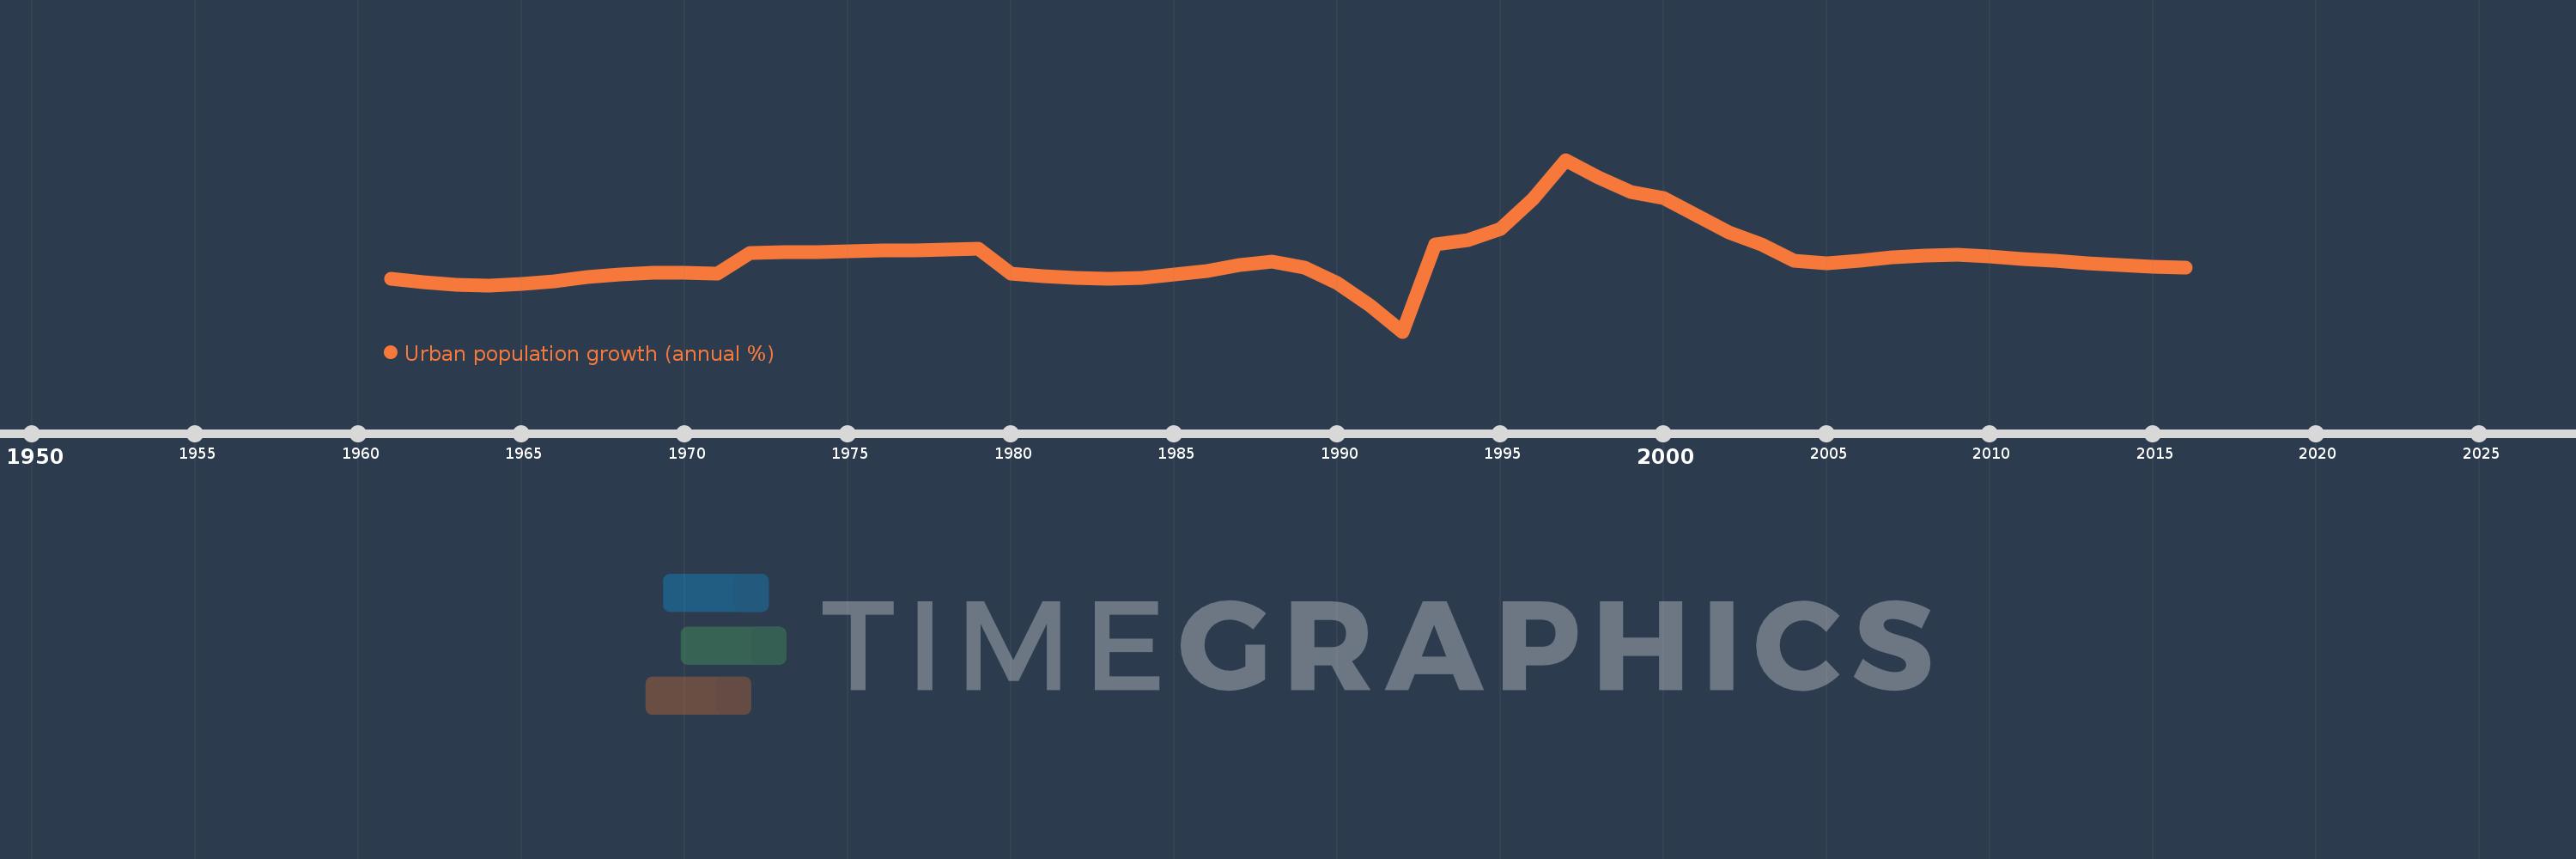
Urban population growth (annual %)
2016,2015,2014,2013,2012,2011,2010,2009,2008,2007,2006,2005,2004,2003,2002,2001,2000,1999,1998,1997,1996,1995,1994,1993,1992,1991,1990,1989,1988,1987,1986,1985,1984,1983,1982,1981,1980,1979,1978,1977,1976,1975,1974,1973,1972,1971,1970,1969,1968,1967,1966,1965,1964,1963,1962,1961
This statistics in other country:
AfghanistanAlbaniaAlgeriaAmerican SamoaAndorraAngolaAntigua and BarbudaArab WorldArgentinaArmeniaArubaAustraliaAustriaAzerbaijanBahamas, TheBahrainBangladeshBarbadosBelarusBelgiumBelizeBeninBermudaBhutanBoliviaBosnia and HerzegovinaBotswanaBrazilBritish Virgin IslandsBrunei DarussalamBulgariaBurkina FasoBurundiCabo VerdeCambodiaCameroonCanadaCaribbean small statesCayman IslandsCentral African RepublicCentral Europe and the BalticsChadChannel IslandsChileChinaColombiaComorosCongo, Dem. Rep.Congo, Rep.Costa RicaCote d'IvoireCroatiaCubaCuracaoCyprusCzech RepublicDenmarkDjiboutiDominicaDominican RepublicEarly-demographic dividendEast Asia & PacificEast Asia & Pacific (excluding high income)East Asia & Pacific (IDA & IBRD countries)EcuadorEgypt, Arab Rep.El SalvadorEquatorial GuineaEritreaEstoniaEthiopiaEuro areaEurope & Central AsiaEurope & Central Asia (excluding high income)Europe & Central Asia (IDA & IBRD countries)European UnionFaroe IslandsFijiFinlandFragile and conflict affected situationsFranceFrench PolynesiaGabonGambia, TheGeorgiaGermanyGhanaGibraltarGreeceGreenlandGrenadaGuamGuatemalaGuineaGuinea-BissauGuyanaHaitiHeavily indebted poor countries (HIPC)High incomeHondurasHong Kong SAR, ChinaHungaryIBRD onlyIcelandIDA & IBRD totalIDA blendIDA onlyIDA totalIndiaIndonesiaIran, Islamic Rep.IraqIrelandIsle of ManIsraelItalyJamaicaJapanJordanKazakhstanKenyaKiribatiKorea, Dem. People’s Rep.Korea, Rep.KuwaitKyrgyz RepublicLao PDRLate-demographic dividendLatin America & Caribbean Latin America & Caribbean (excluding high income)Latin America & the Caribbean (IDA & IBRD countries)LatviaLeast developed countries: UN classificationLebanonLesothoLiberiaLibyaLiechtensteinLithuaniaLow & middle incomeLow incomeLower middle incomeLuxembourgMacao SAR, ChinaMacedonia, FYRMadagascarMalawiMalaysiaMaldivesMaliMaltaMarshall IslandsMauritaniaMauritiusMexicoMicronesia, Fed. Sts.Middle East & North AfricaMiddle East & North Africa (excluding high income)Middle East & North Africa (IDA & IBRD countries)Middle incomeMoldovaMonacoMongoliaMontenegroMoroccoMozambiqueMyanmarNamibiaNauruNepalNetherlandsNew CaledoniaNew ZealandNicaraguaNigerNigeriaNorth AmericaNorthern Mariana IslandsNorwayOECD membersOmanOther small statesPacific island small statesPakistanPalauPanamaPapua New GuineaParaguayPeruPhilippinesPolandPortugalPost-demographic dividendPre-demographic dividendPuerto RicoQatarRomaniaRussian FederationRwandaSamoaSan MarinoSao Tome and PrincipeSaudi ArabiaSenegalSerbiaSeychellesSierra LeoneSingaporeSint Maarten (Dutch part)Slovak RepublicSloveniaSmall statesSolomon IslandsSomaliaSouth AfricaSouth AsiaSouth Asia (IDA & IBRD)South SudanSpainSri LankaSt. Kitts and NevisSt. LuciaSt. Vincent and the GrenadinesSub-Saharan Africa Sub-Saharan Africa (excluding high income)Sub-Saharan Africa (IDA & IBRD countries)SudanSurinameSwazilandSwedenSwitzerlandSyrian Arab RepublicTajikistanTanzaniaThailandTimor-LesteTogoTongaTrinidad and TobagoTunisiaTurkeyTurkmenistanTurks and Caicos IslandsTuvaluUgandaUkraineUnited Arab EmiratesUnited KingdomUnited StatesUpper middle incomeUruguayUzbekistanVanuatuVenezuela, RBVietnamVirgin Islands (U.S.)West Bank and GazaWorldYemen, Rep.ZambiaZimbabwe Timeline:
This timeline shows a graph from 1961 to 2016 of Rwanda. No data until 1960. Number of actual observations by date: 56.
Source name:
World Development Indicators
Source organization:
World Bank Staff estimates based on United Nations, World Urbanization Prospects.
Categories, topics:
Climate Change, Urban Development
Last updated:
apr 23, 2017
Indicators value changes by year
Minimum:
-1.254
jan 1, 1992
Maximum:
17.598
jan 1, 1997
At the date of observation
Value
Absolute change
Change from previous value
jan 1, 1961
4.57
+4.57
0.0%
jan 1, 1962
4.169
-0.401
-8.77%
jan 1, 1963
3.891
-0.278
-6.67%
jan 1, 1964
3.748
-0.143
-3.69%
jan 1, 1965
3.951
+0.203
5.43%
jan 1, 1966
4.26
+0.309
7.82%
jan 1, 1967
4.69
+0.43
10.09%
jan 1, 1968
4.999
+0.308
6.58%
jan 1, 1969
5.214
+0.215
4.3%
jan 1, 1970
5.196
-0.018
-0.34%
jan 1, 1971
5.138
-0.058
-1.12%
jan 1, 1972
7.336
+2.198
42.78%
jan 1, 1973
7.48
+0.144
1.96%
jan 1, 1974
7.443
-0.037
-0.49%
jan 1, 1975
7.513
+0.07
0.95%
jan 1, 1976
7.611
+0.098
1.3%
jan 1, 1977
7.673
+0.062
0.82%
jan 1, 1978
7.733
+0.06
0.78%
jan 1, 1979
7.8
+0.067
0.87%
jan 1, 1980
5.117
-2.683
-34.4%
jan 1, 1981
4.793
-0.324
-6.33%
jan 1, 1982
4.68
-0.113
-2.37%
jan 1, 1983
4.585
-0.095
-2.02%
jan 1, 1984
4.649
+0.064
1.4%
jan 1, 1985
4.981
+0.332
7.14%
jan 1, 1986
5.383
+0.402
8.07%
jan 1, 1987
6.047
+0.664
12.33%
jan 1, 1988
6.422
+0.375
6.2%
jan 1, 1989
5.81
-0.612
-9.52%
jan 1, 1990
4.031
-1.779
-30.62%
jan 1, 1991
1.661
-2.371
-58.81%
jan 1, 1992
-1.254
-2.914
-175.49%
jan 1, 1993
8.351
+9.605
-766.2%
jan 1, 1994
8.758
+0.407
4.87%
jan 1, 1995
9.972
+1.214
13.86%
jan 1, 1996
13.328
+3.357
33.66%
jan 1, 1997
17.598
+4.269
32.03%
jan 1, 1998
15.651
-1.947
-11.06%
jan 1, 1999
14.043
-1.608
-10.28%
jan 1, 2000
13.364
-0.679
-4.84%
jan 1, 2001
11.547
-1.817
-13.6%
jan 1, 2002
9.632
-1.914
-16.58%
jan 1, 2003
8.306
-1.327
-13.77%
jan 1, 2004
6.49
-1.816
-21.87%
jan 1, 2005
6.225
-0.265
-4.08%
jan 1, 2006
6.551
+0.326
5.24%
jan 1, 2007
6.936
+0.385
5.87%
jan 1, 2008
7.119
+0.183
2.64%
jan 1, 2009
7.198
+0.079
1.11%
jan 1, 2010
7.017
-0.181
-2.51%
jan 1, 2011
6.757
-0.261
-3.71%
jan 1, 2012
6.49
-0.266
-3.94%
jan 1, 2013
6.268
-0.223
-3.43%
jan 1, 2014
6.078
-0.19
-3.03%
jan 1, 2015
5.904
-0.174
-2.86%
jan 1, 2016
5.761
-0.143
-2.42%
Ranking of countries by current statistics by years


Comments: