29
/
en
AIzaSyAYiBZKx7MnpbEhh9jyipgxe19OcubqV5w
April 1, 2024
143693
Grenada
GRD
true
2
1
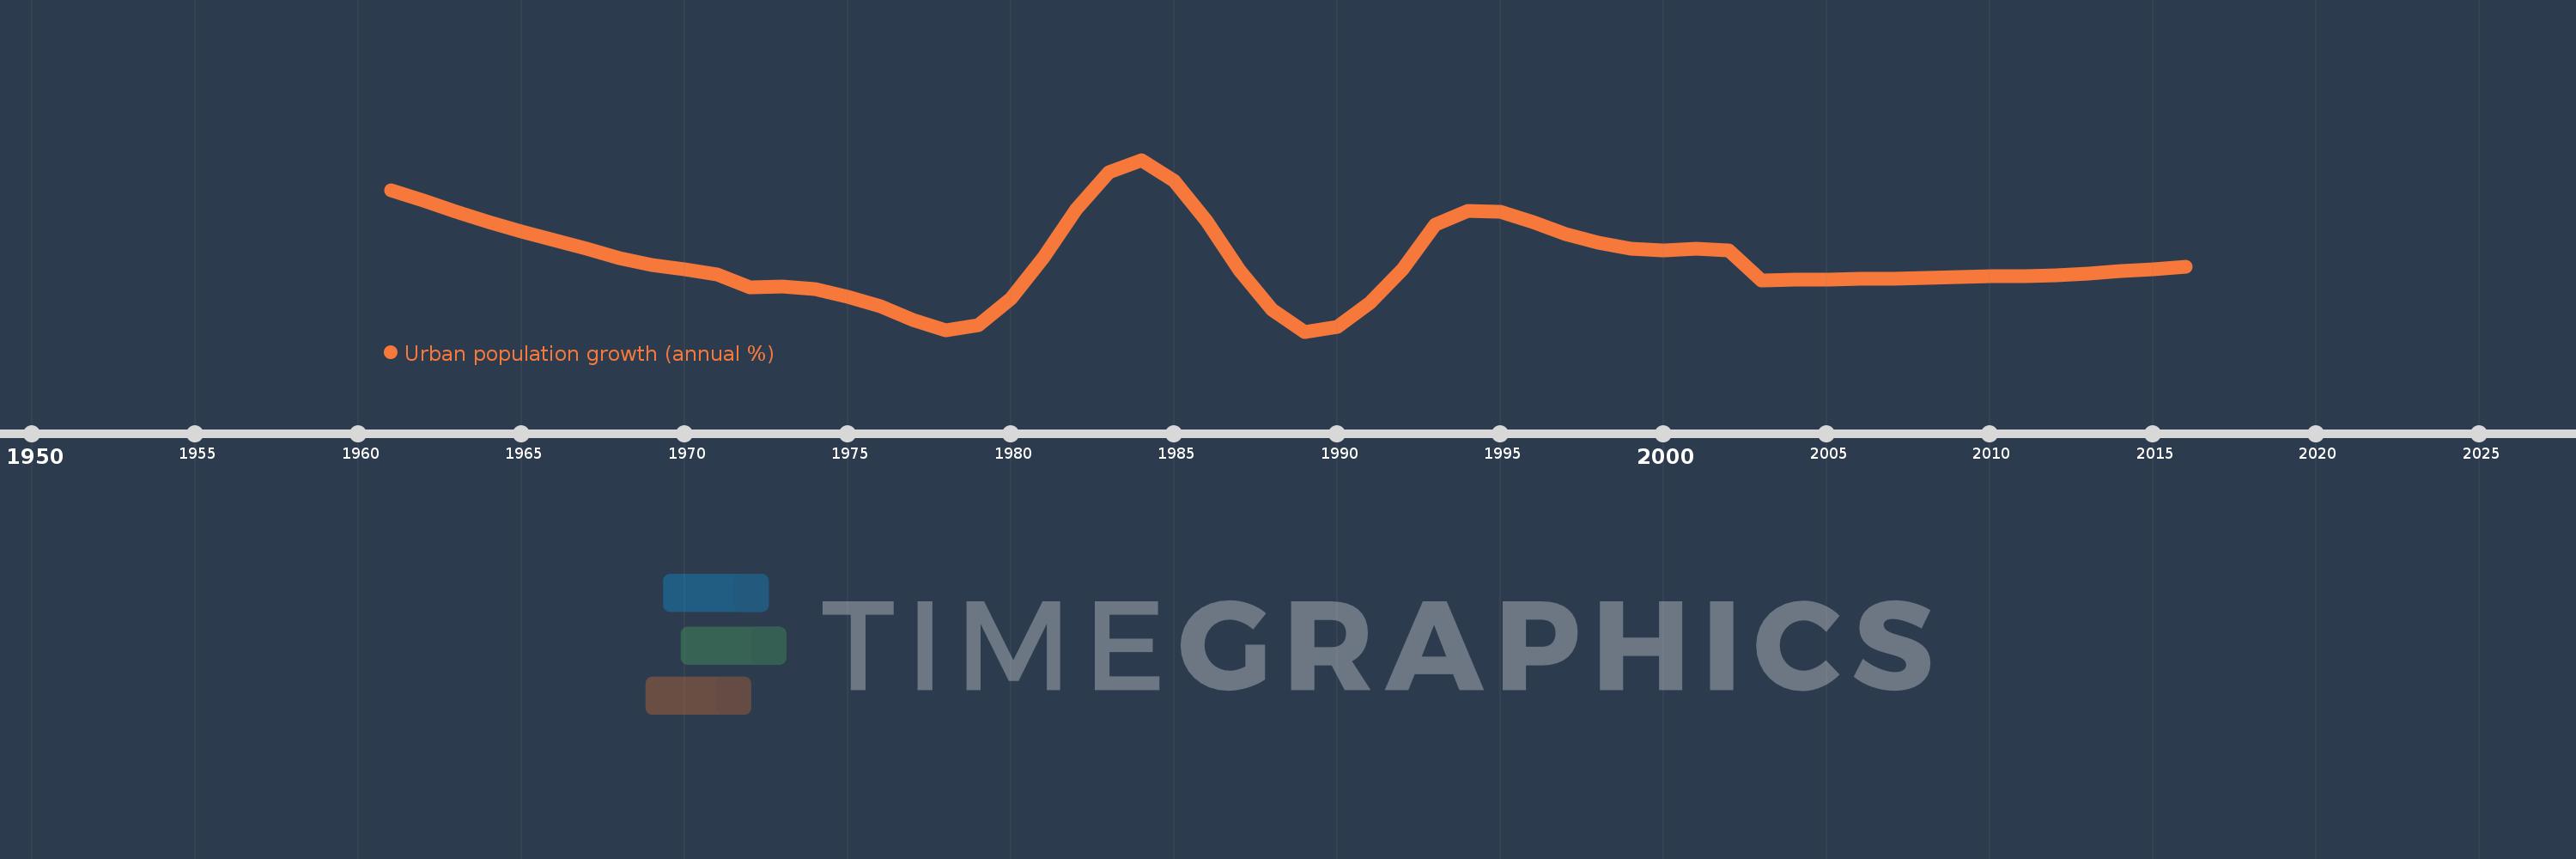
Urban population growth (annual %)
2016,2015,2014,2013,2012,2011,2010,2009,2008,2007,2006,2005,2004,2003,2002,2001,2000,1999,1998,1997,1996,1995,1994,1993,1992,1991,1990,1989,1988,1987,1986,1985,1984,1983,1982,1981,1980,1979,1978,1977,1976,1975,1974,1973,1972,1971,1970,1969,1968,1967,1966,1965,1964,1963,1962,1961
This statistics in other country:
AfghanistanAlbaniaAlgeriaAmerican SamoaAndorraAngolaAntigua and BarbudaArab WorldArgentinaArmeniaArubaAustraliaAustriaAzerbaijanBahamas, TheBahrainBangladeshBarbadosBelarusBelgiumBelizeBeninBermudaBhutanBoliviaBosnia and HerzegovinaBotswanaBrazilBritish Virgin IslandsBrunei DarussalamBulgariaBurkina FasoBurundiCabo VerdeCambodiaCameroonCanadaCaribbean small statesCayman IslandsCentral African RepublicCentral Europe and the BalticsChadChannel IslandsChileChinaColombiaComorosCongo, Dem. Rep.Congo, Rep.Costa RicaCote d'IvoireCroatiaCubaCuracaoCyprusCzech RepublicDenmarkDjiboutiDominicaDominican RepublicEarly-demographic dividendEast Asia & PacificEast Asia & Pacific (excluding high income)East Asia & Pacific (IDA & IBRD countries)EcuadorEgypt, Arab Rep.El SalvadorEquatorial GuineaEritreaEstoniaEthiopiaEuro areaEurope & Central AsiaEurope & Central Asia (excluding high income)Europe & Central Asia (IDA & IBRD countries)European UnionFaroe IslandsFijiFinlandFragile and conflict affected situationsFranceFrench PolynesiaGabonGambia, TheGeorgiaGermanyGhanaGibraltarGreeceGreenlandGrenadaGuamGuatemalaGuineaGuinea-BissauGuyanaHaitiHeavily indebted poor countries (HIPC)High incomeHondurasHong Kong SAR, ChinaHungaryIBRD onlyIcelandIDA & IBRD totalIDA blendIDA onlyIDA totalIndiaIndonesiaIran, Islamic Rep.IraqIrelandIsle of ManIsraelItalyJamaicaJapanJordanKazakhstanKenyaKiribatiKorea, Dem. People’s Rep.Korea, Rep.KuwaitKyrgyz RepublicLao PDRLate-demographic dividendLatin America & Caribbean Latin America & Caribbean (excluding high income)Latin America & the Caribbean (IDA & IBRD countries)LatviaLeast developed countries: UN classificationLebanonLesothoLiberiaLibyaLiechtensteinLithuaniaLow & middle incomeLow incomeLower middle incomeLuxembourgMacao SAR, ChinaMacedonia, FYRMadagascarMalawiMalaysiaMaldivesMaliMaltaMarshall IslandsMauritaniaMauritiusMexicoMicronesia, Fed. Sts.Middle East & North AfricaMiddle East & North Africa (excluding high income)Middle East & North Africa (IDA & IBRD countries)Middle incomeMoldovaMonacoMongoliaMontenegroMoroccoMozambiqueMyanmarNamibiaNauruNepalNetherlandsNew CaledoniaNew ZealandNicaraguaNigerNigeriaNorth AmericaNorthern Mariana IslandsNorwayOECD membersOmanOther small statesPacific island small statesPakistanPalauPanamaPapua New GuineaParaguayPeruPhilippinesPolandPortugalPost-demographic dividendPre-demographic dividendPuerto RicoQatarRomaniaRussian FederationRwandaSamoaSan MarinoSao Tome and PrincipeSaudi ArabiaSenegalSerbiaSeychellesSierra LeoneSingaporeSint Maarten (Dutch part)Slovak RepublicSloveniaSmall statesSolomon IslandsSomaliaSouth AfricaSouth AsiaSouth Asia (IDA & IBRD)South SudanSpainSri LankaSt. Kitts and NevisSt. LuciaSt. Vincent and the GrenadinesSub-Saharan Africa Sub-Saharan Africa (excluding high income)Sub-Saharan Africa (IDA & IBRD countries)SudanSurinameSwazilandSwedenSwitzerlandSyrian Arab RepublicTajikistanTanzaniaThailandTimor-LesteTogoTongaTrinidad and TobagoTunisiaTurkeyTurkmenistanTurks and Caicos IslandsTuvaluUgandaUkraineUnited Arab EmiratesUnited KingdomUnited StatesUpper middle incomeUruguayUzbekistanVanuatuVenezuela, RBVietnamVirgin Islands (U.S.)West Bank and GazaWorldYemen, Rep.ZambiaZimbabwe Timeline:
This timeline shows a graph from 1961 to 2016 of Grenada. No data until 1960. Number of actual observations by date: 56.
Source name:
World Development Indicators
Source organization:
World Bank Staff estimates based on United Nations, World Urbanization Prospects.
Categories, topics:
Climate Change, Urban Development
Last updated:
apr 23, 2017
Indicators value changes by year
Minimum:
-1.189
jan 1, 1989
At the date of observation
Value
Absolute change
Change from previous value
jan 1, 1961
2.421
+2.421
0.0%
jan 1, 1962
2.159
-0.262
-10.81%
jan 1, 1963
1.882
-0.278
-12.87%
jan 1, 1964
1.611
-0.27
-14.36%
jan 1, 1965
1.37
-0.241
-14.94%
jan 1, 1966
1.153
-0.218
-15.89%
jan 1, 1967
0.922
-0.231
-20.01%
jan 1, 1968
0.694
-0.228
-24.7%
jan 1, 1969
0.514
-0.18
-25.93%
jan 1, 1970
0.396
-0.118
-22.93%
jan 1, 1971
0.27
-0.126
-31.89%
jan 1, 1972
-0.049
-0.319
-118.27%
jan 1, 1973
-0.039
+0.01
-19.96%
jan 1, 1974
-0.109
-0.069
175.2%
jan 1, 1975
-0.294
-0.185
170.24%
jan 1, 1976
-0.537
-0.243
82.78%
jan 1, 1977
-0.887
-0.351
65.37%
jan 1, 1978
-1.159
-0.272
30.65%
jan 1, 1979
-1.029
+0.13
-11.24%
jan 1, 1980
-0.34
+0.689
-66.99%
jan 1, 1981
0.702
+1.042
-306.7%
jan 1, 1982
1.953
+1.251
178.23%
jan 1, 1983
2.886
+0.933
47.76%
jan 1, 1984
3.206
+0.32
11.08%
jan 1, 1985
2.678
-0.528
-16.47%
jan 1, 1986
1.624
-1.054
-39.37%
jan 1, 1987
0.388
-1.236
-76.08%
jan 1, 1988
-0.621
-1.009
-259.88%
jan 1, 1989
-1.189
-0.568
91.53%
jan 1, 1990
-1.074
+0.116
-9.73%
jan 1, 1991
-0.462
+0.612
-56.98%
jan 1, 1992
0.409
+0.871
-188.61%
jan 1, 1993
1.541
+1.132
276.61%
jan 1, 1994
1.892
+0.351
22.77%
jan 1, 1995
1.878
-0.015
-0.77%
jan 1, 1996
1.612
-0.265
-14.13%
jan 1, 1997
1.299
-0.313
-19.41%
jan 1, 1998
1.08
-0.219
-16.89%
jan 1, 1999
0.926
-0.154
-14.25%
jan 1, 2000
0.884
-0.042
-4.5%
jan 1, 2001
0.923
+0.039
4.4%
jan 1, 2002
0.877
-0.047
-5.04%
jan 1, 2003
0.114
-0.763
-86.98%
jan 1, 2004
0.136
+0.022
18.9%
jan 1, 2005
0.146
+0.011
7.85%
jan 1, 2006
0.154
+0.008
5.4%
jan 1, 2007
0.168
+0.013
8.6%
jan 1, 2008
0.186
+0.019
11.09%
jan 1, 2009
0.202
+0.016
8.48%
jan 1, 2010
0.22
+0.018
9.1%
jan 1, 2011
0.231
+0.01
4.64%
jan 1, 2012
0.243
+0.013
5.56%
jan 1, 2013
0.293
+0.05
20.56%
jan 1, 2014
0.351
+0.058
19.61%
jan 1, 2015
0.413
+0.062
17.73%
jan 1, 2016
0.477
+0.064
15.51%
Ranking of countries by current statistics by years


Comments: