29
/
en
AIzaSyAYiBZKx7MnpbEhh9jyipgxe19OcubqV5w
April 1, 2024
151263
Honduras
HND
true
2
1
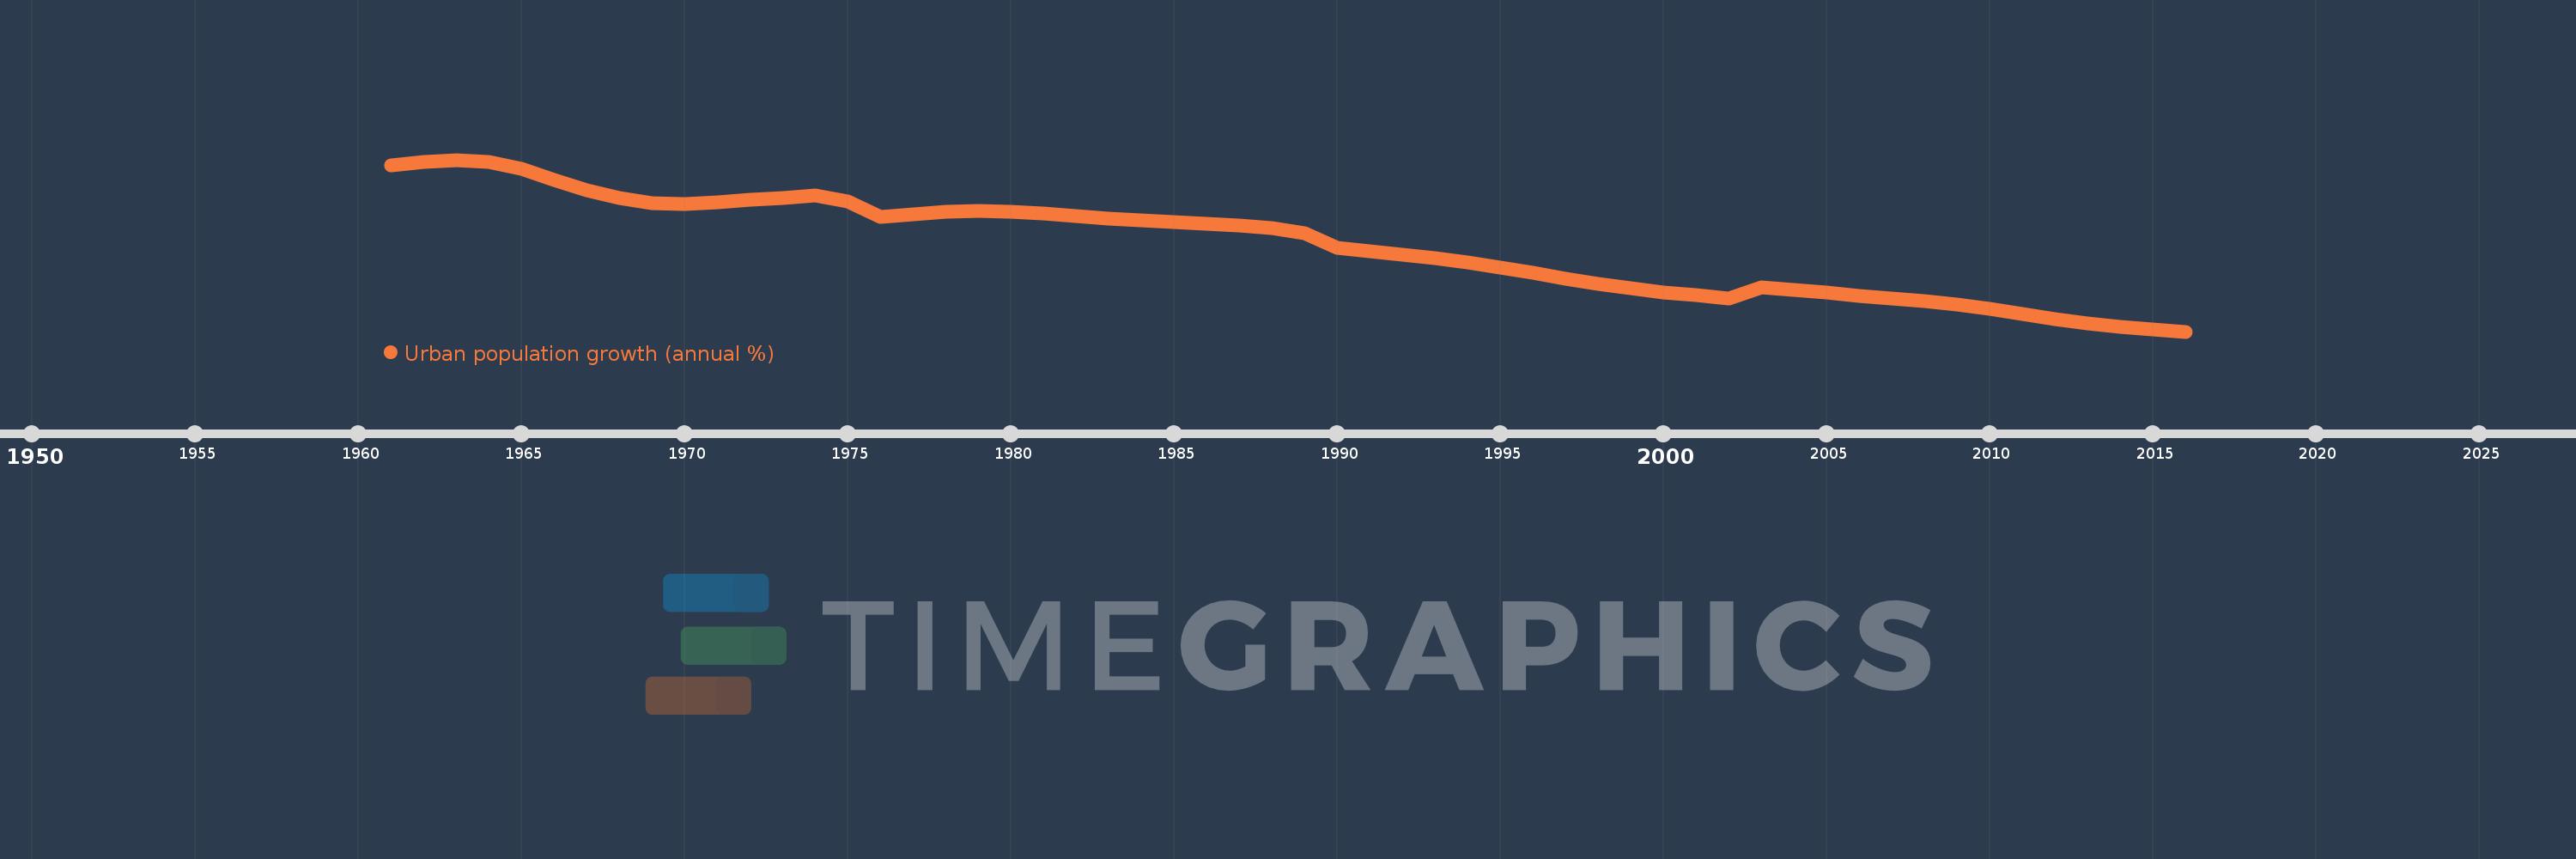
Urban population growth (annual %)
2016,2015,2014,2013,2012,2011,2010,2009,2008,2007,2006,2005,2004,2003,2002,2001,2000,1999,1998,1997,1996,1995,1994,1993,1992,1991,1990,1989,1988,1987,1986,1985,1984,1983,1982,1981,1980,1979,1978,1977,1976,1975,1974,1973,1972,1971,1970,1969,1968,1967,1966,1965,1964,1963,1962,1961
This statistics in other country:
AfghanistanAlbaniaAlgeriaAmerican SamoaAndorraAngolaAntigua and BarbudaArab WorldArgentinaArmeniaArubaAustraliaAustriaAzerbaijanBahamas, TheBahrainBangladeshBarbadosBelarusBelgiumBelizeBeninBermudaBhutanBoliviaBosnia and HerzegovinaBotswanaBrazilBritish Virgin IslandsBrunei DarussalamBulgariaBurkina FasoBurundiCabo VerdeCambodiaCameroonCanadaCaribbean small statesCayman IslandsCentral African RepublicCentral Europe and the BalticsChadChannel IslandsChileChinaColombiaComorosCongo, Dem. Rep.Congo, Rep.Costa RicaCote d'IvoireCroatiaCubaCuracaoCyprusCzech RepublicDenmarkDjiboutiDominicaDominican RepublicEarly-demographic dividendEast Asia & PacificEast Asia & Pacific (excluding high income)East Asia & Pacific (IDA & IBRD countries)EcuadorEgypt, Arab Rep.El SalvadorEquatorial GuineaEritreaEstoniaEthiopiaEuro areaEurope & Central AsiaEurope & Central Asia (excluding high income)Europe & Central Asia (IDA & IBRD countries)European UnionFaroe IslandsFijiFinlandFragile and conflict affected situationsFranceFrench PolynesiaGabonGambia, TheGeorgiaGermanyGhanaGibraltarGreeceGreenlandGrenadaGuamGuatemalaGuineaGuinea-BissauGuyanaHaitiHeavily indebted poor countries (HIPC)High incomeHondurasHong Kong SAR, ChinaHungaryIBRD onlyIcelandIDA & IBRD totalIDA blendIDA onlyIDA totalIndiaIndonesiaIran, Islamic Rep.IraqIrelandIsle of ManIsraelItalyJamaicaJapanJordanKazakhstanKenyaKiribatiKorea, Dem. People’s Rep.Korea, Rep.KuwaitKyrgyz RepublicLao PDRLate-demographic dividendLatin America & Caribbean Latin America & Caribbean (excluding high income)Latin America & the Caribbean (IDA & IBRD countries)LatviaLeast developed countries: UN classificationLebanonLesothoLiberiaLibyaLiechtensteinLithuaniaLow & middle incomeLow incomeLower middle incomeLuxembourgMacao SAR, ChinaMacedonia, FYRMadagascarMalawiMalaysiaMaldivesMaliMaltaMarshall IslandsMauritaniaMauritiusMexicoMicronesia, Fed. Sts.Middle East & North AfricaMiddle East & North Africa (excluding high income)Middle East & North Africa (IDA & IBRD countries)Middle incomeMoldovaMonacoMongoliaMontenegroMoroccoMozambiqueMyanmarNamibiaNauruNepalNetherlandsNew CaledoniaNew ZealandNicaraguaNigerNigeriaNorth AmericaNorthern Mariana IslandsNorwayOECD membersOmanOther small statesPacific island small statesPakistanPalauPanamaPapua New GuineaParaguayPeruPhilippinesPolandPortugalPost-demographic dividendPre-demographic dividendPuerto RicoQatarRomaniaRussian FederationRwandaSamoaSan MarinoSao Tome and PrincipeSaudi ArabiaSenegalSerbiaSeychellesSierra LeoneSingaporeSint Maarten (Dutch part)Slovak RepublicSloveniaSmall statesSolomon IslandsSomaliaSouth AfricaSouth AsiaSouth Asia (IDA & IBRD)South SudanSpainSri LankaSt. Kitts and NevisSt. LuciaSt. Vincent and the GrenadinesSub-Saharan Africa Sub-Saharan Africa (excluding high income)Sub-Saharan Africa (IDA & IBRD countries)SudanSurinameSwazilandSwedenSwitzerlandSyrian Arab RepublicTajikistanTanzaniaThailandTimor-LesteTogoTongaTrinidad and TobagoTunisiaTurkeyTurkmenistanTurks and Caicos IslandsTuvaluUgandaUkraineUnited Arab EmiratesUnited KingdomUnited StatesUpper middle incomeUruguayUzbekistanVanuatuVenezuela, RBVietnamVirgin Islands (U.S.)West Bank and GazaWorldYemen, Rep.ZambiaZimbabwe Timeline:
This timeline shows a graph from 1961 to 2016 of Honduras. No data until 1960. Number of actual observations by date: 56.
Source name:
World Development Indicators
Source organization:
World Bank Staff estimates based on United Nations, World Urbanization Prospects.
Categories, topics:
Climate Change, Urban Development
Last updated:
apr 23, 2017
Indicators value changes by year
At the date of observation
Value
Absolute change
Change from previous value
jan 1, 1961
5.689
+5.689
0.0%
jan 1, 1962
5.758
+0.069
1.22%
jan 1, 1963
5.798
+0.04
0.69%
jan 1, 1964
5.75
-0.048
-0.83%
jan 1, 1965
5.62
-0.13
-2.26%
jan 1, 1966
5.417
-0.203
-3.62%
jan 1, 1967
5.22
-0.197
-3.63%
jan 1, 1968
5.058
-0.162
-3.11%
jan 1, 1969
4.967
-0.091
-1.8%
jan 1, 1970
4.943
-0.023
-0.47%
jan 1, 1971
4.988
+0.044
0.9%
jan 1, 1972
5.035
+0.047
0.95%
jan 1, 1973
5.073
+0.038
0.75%
jan 1, 1974
5.109
+0.036
0.72%
jan 1, 1975
4.993
-0.116
-2.28%
jan 1, 1976
4.702
-0.291
-5.82%
jan 1, 1977
4.755
+0.053
1.12%
jan 1, 1978
4.798
+0.043
0.9%
jan 1, 1979
4.817
+0.019
0.4%
jan 1, 1980
4.804
-0.012
-0.26%
jan 1, 1981
4.767
-0.037
-0.77%
jan 1, 1982
4.721
-0.046
-0.97%
jan 1, 1983
4.676
-0.044
-0.94%
jan 1, 1984
4.636
-0.041
-0.87%
jan 1, 1985
4.605
-0.031
-0.66%
jan 1, 1986
4.569
-0.036
-0.78%
jan 1, 1987
4.534
-0.035
-0.77%
jan 1, 1988
4.489
-0.044
-0.98%
jan 1, 1989
4.392
-0.097
-2.17%
jan 1, 1990
4.108
-0.284
-6.46%
jan 1, 1991
4.046
-0.063
-1.52%
jan 1, 1992
3.98
-0.065
-1.61%
jan 1, 1993
3.912
-0.068
-1.72%
jan 1, 1994
3.826
-0.086
-2.2%
jan 1, 1995
3.732
-0.094
-2.45%
jan 1, 1996
3.627
-0.105
-2.8%
jan 1, 1997
3.519
-0.109
-3.0%
jan 1, 1998
3.418
-0.101
-2.87%
jan 1, 1999
3.329
-0.088
-2.59%
jan 1, 2000
3.26
-0.07
-2.09%
jan 1, 2001
3.2
-0.06
-1.84%
jan 1, 2002
3.14
-0.06
-1.87%
jan 1, 2003
3.344
+0.204
6.48%
jan 1, 2004
3.304
-0.04
-1.18%
jan 1, 2005
3.249
-0.055
-1.66%
jan 1, 2006
3.191
-0.059
-1.8%
jan 1, 2007
3.141
-0.049
-1.54%
jan 1, 2008
3.09
-0.052
-1.65%
jan 1, 2009
3.02
-0.07
-2.25%
jan 1, 2010
2.934
-0.086
-2.86%
jan 1, 2011
2.841
-0.093
-3.17%
jan 1, 2012
2.746
-0.095
-3.33%
jan 1, 2013
2.661
-0.086
-3.12%
jan 1, 2014
2.589
-0.071
-2.68%
jan 1, 2015
2.539
-0.05
-1.94%
jan 1, 2016
2.503
-0.036
-1.41%
Ranking of countries by current statistics by years


Comments: