29
/
en
AIzaSyAYiBZKx7MnpbEhh9jyipgxe19OcubqV5w
April 1, 2024
189766
Maldives
MDV
true
2
1
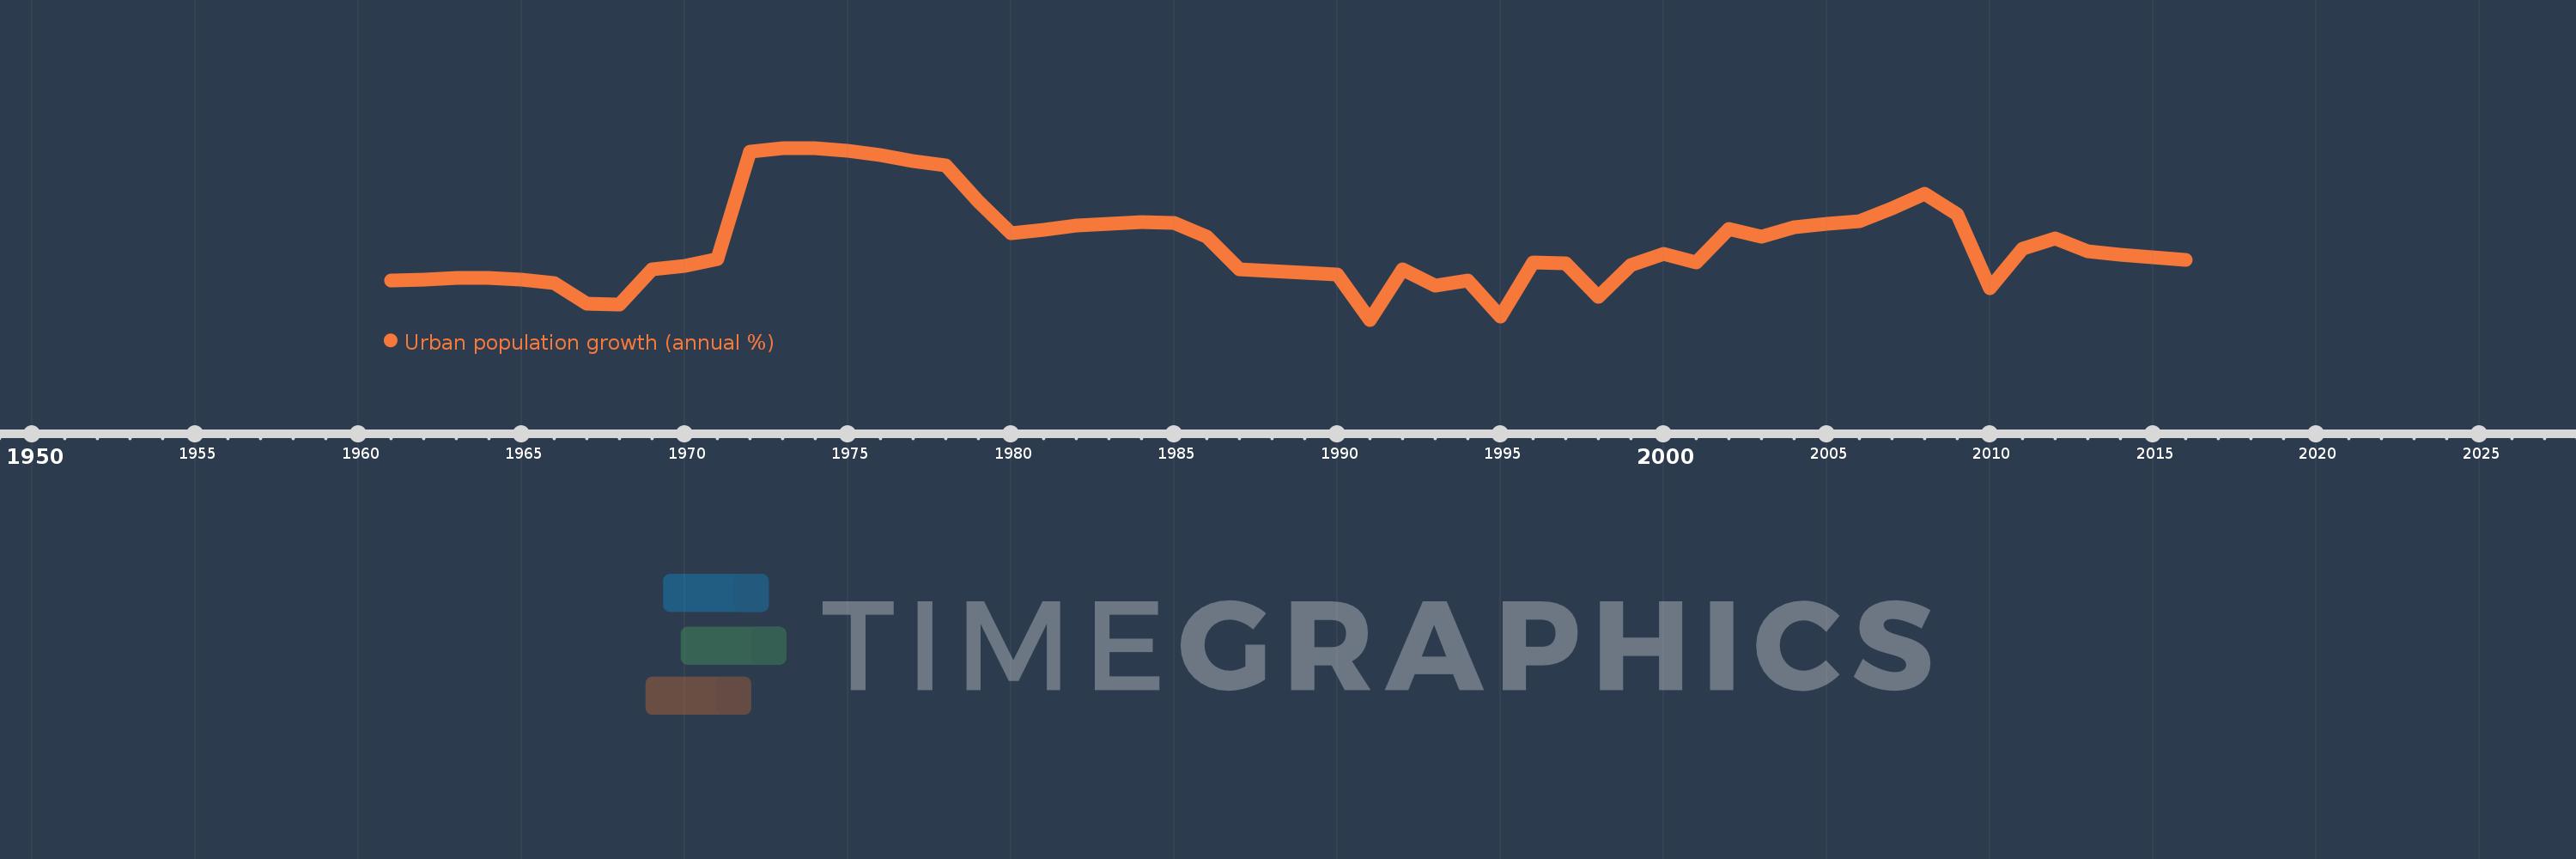
Urban population growth (annual %)
2016,2015,2014,2013,2012,2011,2010,2009,2008,2007,2006,2005,2004,2003,2002,2001,2000,1999,1998,1997,1996,1995,1994,1993,1992,1991,1990,1989,1988,1987,1986,1985,1984,1983,1982,1981,1980,1979,1978,1977,1976,1975,1974,1973,1972,1971,1970,1969,1968,1967,1966,1965,1964,1963,1962,1961
This statistics in other country:
AfghanistanAlbaniaAlgeriaAmerican SamoaAndorraAngolaAntigua and BarbudaArab WorldArgentinaArmeniaArubaAustraliaAustriaAzerbaijanBahamas, TheBahrainBangladeshBarbadosBelarusBelgiumBelizeBeninBermudaBhutanBoliviaBosnia and HerzegovinaBotswanaBrazilBritish Virgin IslandsBrunei DarussalamBulgariaBurkina FasoBurundiCabo VerdeCambodiaCameroonCanadaCaribbean small statesCayman IslandsCentral African RepublicCentral Europe and the BalticsChadChannel IslandsChileChinaColombiaComorosCongo, Dem. Rep.Congo, Rep.Costa RicaCote d'IvoireCroatiaCubaCuracaoCyprusCzech RepublicDenmarkDjiboutiDominicaDominican RepublicEarly-demographic dividendEast Asia & PacificEast Asia & Pacific (excluding high income)East Asia & Pacific (IDA & IBRD countries)EcuadorEgypt, Arab Rep.El SalvadorEquatorial GuineaEritreaEstoniaEthiopiaEuro areaEurope & Central AsiaEurope & Central Asia (excluding high income)Europe & Central Asia (IDA & IBRD countries)European UnionFaroe IslandsFijiFinlandFragile and conflict affected situationsFranceFrench PolynesiaGabonGambia, TheGeorgiaGermanyGhanaGibraltarGreeceGreenlandGrenadaGuamGuatemalaGuineaGuinea-BissauGuyanaHaitiHeavily indebted poor countries (HIPC)High incomeHondurasHong Kong SAR, ChinaHungaryIBRD onlyIcelandIDA & IBRD totalIDA blendIDA onlyIDA totalIndiaIndonesiaIran, Islamic Rep.IraqIrelandIsle of ManIsraelItalyJamaicaJapanJordanKazakhstanKenyaKiribatiKorea, Dem. People’s Rep.Korea, Rep.KuwaitKyrgyz RepublicLao PDRLate-demographic dividendLatin America & Caribbean Latin America & Caribbean (excluding high income)Latin America & the Caribbean (IDA & IBRD countries)LatviaLeast developed countries: UN classificationLebanonLesothoLiberiaLibyaLiechtensteinLithuaniaLow & middle incomeLow incomeLower middle incomeLuxembourgMacao SAR, ChinaMacedonia, FYRMadagascarMalawiMalaysiaMaldivesMaliMaltaMarshall IslandsMauritaniaMauritiusMexicoMicronesia, Fed. Sts.Middle East & North AfricaMiddle East & North Africa (excluding high income)Middle East & North Africa (IDA & IBRD countries)Middle incomeMoldovaMonacoMongoliaMontenegroMoroccoMozambiqueMyanmarNamibiaNauruNepalNetherlandsNew CaledoniaNew ZealandNicaraguaNigerNigeriaNorth AmericaNorthern Mariana IslandsNorwayOECD membersOmanOther small statesPacific island small statesPakistanPalauPanamaPapua New GuineaParaguayPeruPhilippinesPolandPortugalPost-demographic dividendPre-demographic dividendPuerto RicoQatarRomaniaRussian FederationRwandaSamoaSan MarinoSao Tome and PrincipeSaudi ArabiaSenegalSerbiaSeychellesSierra LeoneSingaporeSint Maarten (Dutch part)Slovak RepublicSloveniaSmall statesSolomon IslandsSomaliaSouth AfricaSouth AsiaSouth Asia (IDA & IBRD)South SudanSpainSri LankaSt. Kitts and NevisSt. LuciaSt. Vincent and the GrenadinesSub-Saharan Africa Sub-Saharan Africa (excluding high income)Sub-Saharan Africa (IDA & IBRD countries)SudanSurinameSwazilandSwedenSwitzerlandSyrian Arab RepublicTajikistanTanzaniaThailandTimor-LesteTogoTongaTrinidad and TobagoTunisiaTurkeyTurkmenistanTurks and Caicos IslandsTuvaluUgandaUkraineUnited Arab EmiratesUnited KingdomUnited StatesUpper middle incomeUruguayUzbekistanVanuatuVenezuela, RBVietnamVirgin Islands (U.S.)West Bank and GazaWorldYemen, Rep.ZambiaZimbabwe Timeline:
This timeline shows a graph from 1961 to 2016 of Maldives. No data until 1960. Number of actual observations by date: 56.
Source name:
World Development Indicators
Source organization:
World Bank Staff estimates based on United Nations, World Urbanization Prospects.
Categories, topics:
Climate Change, Urban Development
Last updated:
apr 23, 2017
Indicators value changes by year
Maximum:
10.961
jan 1, 1973
At the date of observation
Value
Absolute change
Change from previous value
jan 1, 1961
3.105
+3.105
0.0%
jan 1, 1962
3.195
+0.09
2.9%
jan 1, 1963
3.273
+0.079
2.46%
jan 1, 1964
3.26
-0.013
-0.41%
jan 1, 1965
3.166
-0.094
-2.89%
jan 1, 1966
2.984
-0.182
-5.75%
jan 1, 1967
1.76
-1.224
-41.01%
jan 1, 1968
1.705
-0.055
-3.13%
jan 1, 1969
3.793
+2.088
122.43%
jan 1, 1970
3.989
+0.196
5.17%
jan 1, 1971
4.382
+0.394
9.87%
jan 1, 1972
10.745
+6.363
145.2%
jan 1, 1973
10.961
+0.216
2.01%
jan 1, 1974
10.953
-0.009
-0.08%
jan 1, 1975
10.802
-0.151
-1.38%
jan 1, 1976
10.518
-0.284
-2.63%
jan 1, 1977
10.195
-0.322
-3.06%
jan 1, 1978
9.915
-0.28
-2.75%
jan 1, 1979
7.817
-2.099
-21.17%
jan 1, 1980
5.924
-1.893
-24.21%
jan 1, 1981
6.142
+0.218
3.68%
jan 1, 1982
6.348
+0.206
3.35%
jan 1, 1983
6.492
+0.144
2.27%
jan 1, 1984
6.553
+0.061
0.94%
jan 1, 1985
6.512
-0.041
-0.62%
jan 1, 1986
5.719
-0.793
-12.17%
jan 1, 1987
3.801
-1.918
-33.54%
jan 1, 1988
3.698
-0.103
-2.7%
jan 1, 1989
3.587
-0.112
-3.02%
jan 1, 1990
3.461
-0.126
-3.51%
jan 1, 1991
0.797
-2.664
-76.98%
jan 1, 1992
3.799
+3.002
376.81%
jan 1, 1993
2.791
-1.008
-26.53%
jan 1, 1994
3.114
+0.323
11.57%
jan 1, 1995
0.986
-2.128
-68.34%
jan 1, 1996
4.203
+3.217
326.32%
jan 1, 1997
4.141
-0.062
-1.48%
jan 1, 1998
2.177
-1.963
-47.42%
jan 1, 1999
4.032
+1.854
85.15%
jan 1, 2000
4.674
+0.642
15.92%
jan 1, 2001
4.206
-0.467
-9.99%
jan 1, 2002
6.153
+1.947
46.28%
jan 1, 2003
5.716
-0.437
-7.11%
jan 1, 2004
6.278
+0.562
9.83%
jan 1, 2005
6.483
+0.205
3.26%
jan 1, 2006
6.649
+0.166
2.56%
jan 1, 2007
7.403
+0.754
11.35%
jan 1, 2008
8.251
+0.848
11.45%
jan 1, 2009
7.043
-1.208
-14.64%
jan 1, 2010
2.664
-4.379
-62.18%
jan 1, 2011
4.98
+2.316
86.95%
jan 1, 2012
5.585
+0.604
12.14%
jan 1, 2013
4.842
-0.743
-13.3%
jan 1, 2014
4.653
-0.188
-3.89%
jan 1, 2015
4.468
-0.186
-3.99%
jan 1, 2016
4.33
-0.138
-3.09%
Ranking of countries by current statistics by years


Comments: