29
/
en
AIzaSyAYiBZKx7MnpbEhh9jyipgxe19OcubqV5w
April 1, 2024
142664
Greenland
GRL
true
2
1
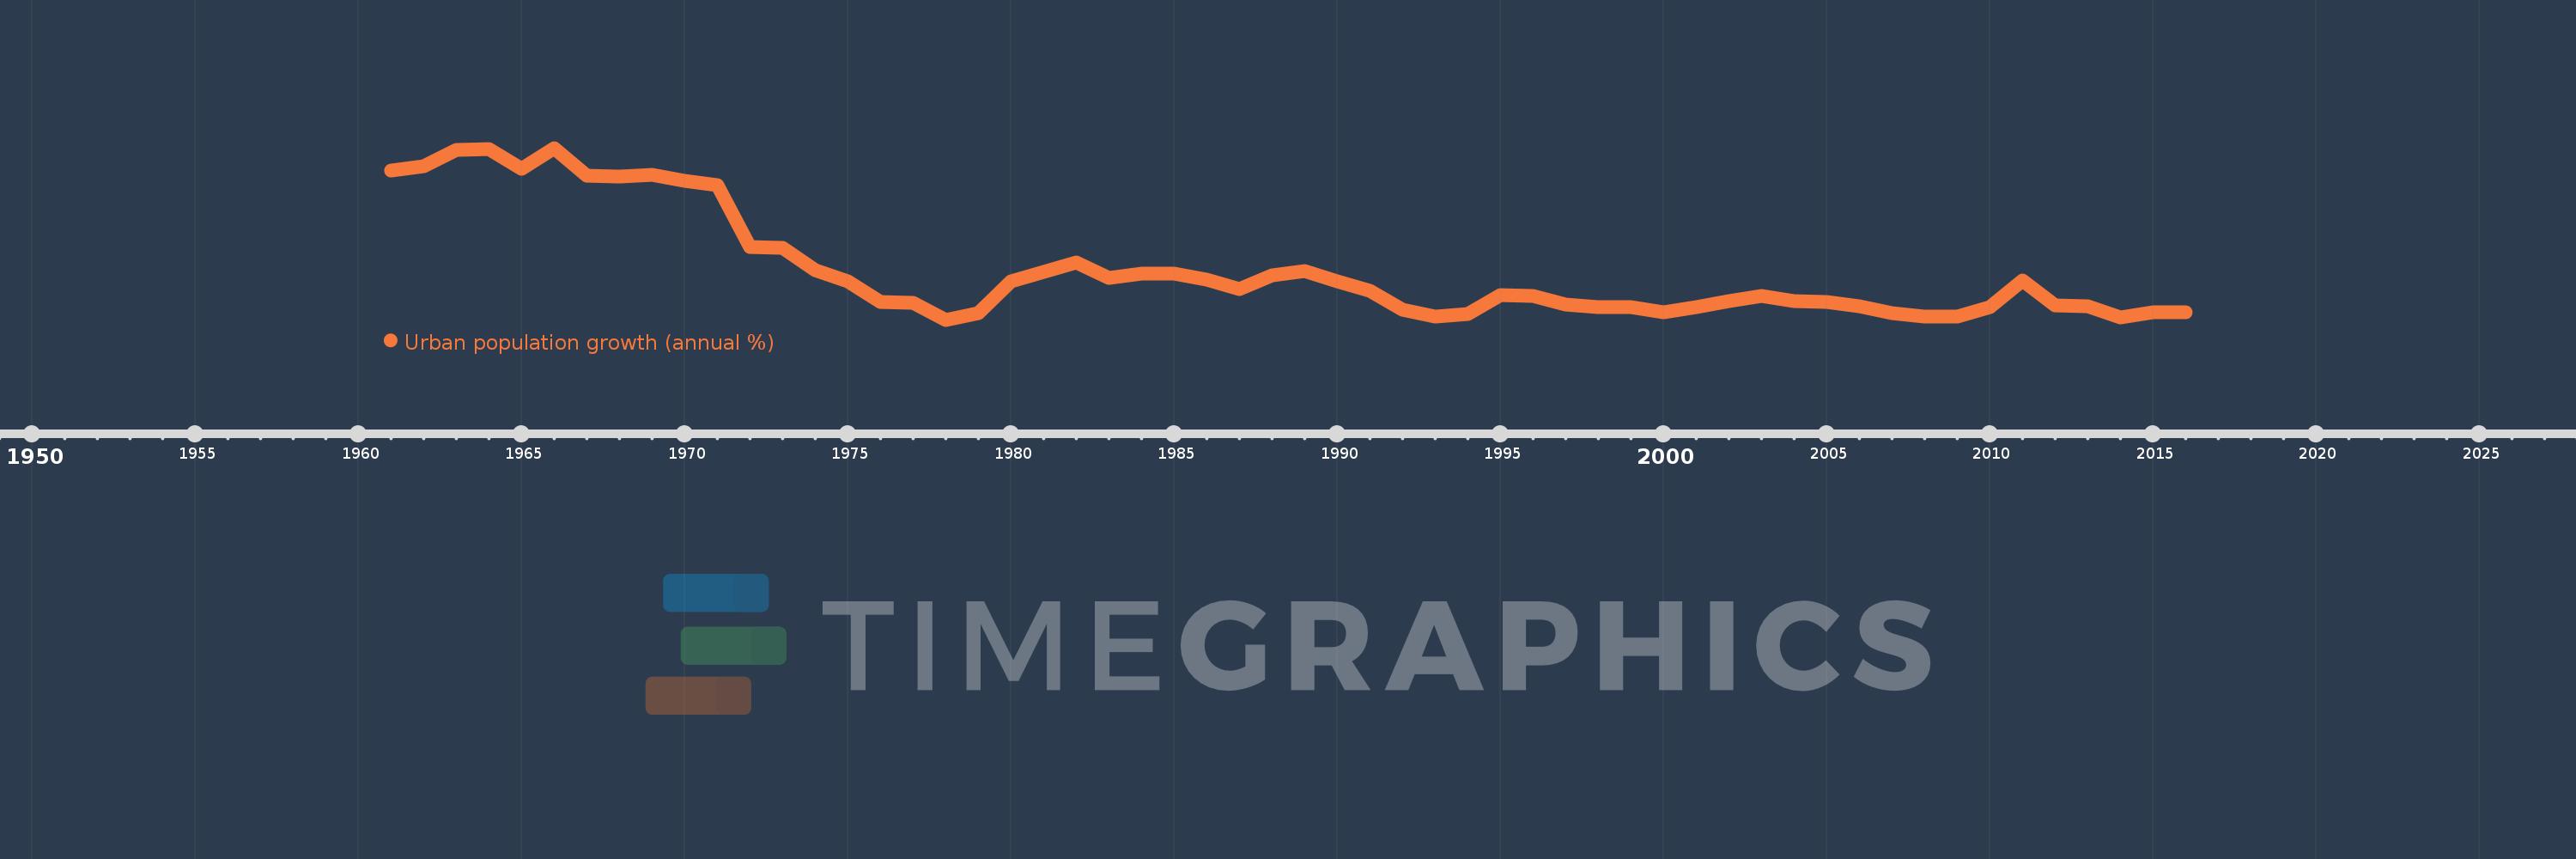
Urban population growth (annual %)
2016,2015,2014,2013,2012,2011,2010,2009,2008,2007,2006,2005,2004,2003,2002,2001,2000,1999,1998,1997,1996,1995,1994,1993,1992,1991,1990,1989,1988,1987,1986,1985,1984,1983,1982,1981,1980,1979,1978,1977,1976,1975,1974,1973,1972,1971,1970,1969,1968,1967,1966,1965,1964,1963,1962,1961
This statistics in other country:
AfghanistanAlbaniaAlgeriaAmerican SamoaAndorraAngolaAntigua and BarbudaArab WorldArgentinaArmeniaArubaAustraliaAustriaAzerbaijanBahamas, TheBahrainBangladeshBarbadosBelarusBelgiumBelizeBeninBermudaBhutanBoliviaBosnia and HerzegovinaBotswanaBrazilBritish Virgin IslandsBrunei DarussalamBulgariaBurkina FasoBurundiCabo VerdeCambodiaCameroonCanadaCaribbean small statesCayman IslandsCentral African RepublicCentral Europe and the BalticsChadChannel IslandsChileChinaColombiaComorosCongo, Dem. Rep.Congo, Rep.Costa RicaCote d'IvoireCroatiaCubaCuracaoCyprusCzech RepublicDenmarkDjiboutiDominicaDominican RepublicEarly-demographic dividendEast Asia & PacificEast Asia & Pacific (excluding high income)East Asia & Pacific (IDA & IBRD countries)EcuadorEgypt, Arab Rep.El SalvadorEquatorial GuineaEritreaEstoniaEthiopiaEuro areaEurope & Central AsiaEurope & Central Asia (excluding high income)Europe & Central Asia (IDA & IBRD countries)European UnionFaroe IslandsFijiFinlandFragile and conflict affected situationsFranceFrench PolynesiaGabonGambia, TheGeorgiaGermanyGhanaGibraltarGreeceGreenlandGrenadaGuamGuatemalaGuineaGuinea-BissauGuyanaHaitiHeavily indebted poor countries (HIPC)High incomeHondurasHong Kong SAR, ChinaHungaryIBRD onlyIcelandIDA & IBRD totalIDA blendIDA onlyIDA totalIndiaIndonesiaIran, Islamic Rep.IraqIrelandIsle of ManIsraelItalyJamaicaJapanJordanKazakhstanKenyaKiribatiKorea, Dem. People’s Rep.Korea, Rep.KuwaitKyrgyz RepublicLao PDRLate-demographic dividendLatin America & Caribbean Latin America & Caribbean (excluding high income)Latin America & the Caribbean (IDA & IBRD countries)LatviaLeast developed countries: UN classificationLebanonLesothoLiberiaLibyaLiechtensteinLithuaniaLow & middle incomeLow incomeLower middle incomeLuxembourgMacao SAR, ChinaMacedonia, FYRMadagascarMalawiMalaysiaMaldivesMaliMaltaMarshall IslandsMauritaniaMauritiusMexicoMicronesia, Fed. Sts.Middle East & North AfricaMiddle East & North Africa (excluding high income)Middle East & North Africa (IDA & IBRD countries)Middle incomeMoldovaMonacoMongoliaMontenegroMoroccoMozambiqueMyanmarNamibiaNauruNepalNetherlandsNew CaledoniaNew ZealandNicaraguaNigerNigeriaNorth AmericaNorthern Mariana IslandsNorwayOECD membersOmanOther small statesPacific island small statesPakistanPalauPanamaPapua New GuineaParaguayPeruPhilippinesPolandPortugalPost-demographic dividendPre-demographic dividendPuerto RicoQatarRomaniaRussian FederationRwandaSamoaSan MarinoSao Tome and PrincipeSaudi ArabiaSenegalSerbiaSeychellesSierra LeoneSingaporeSint Maarten (Dutch part)Slovak RepublicSloveniaSmall statesSolomon IslandsSomaliaSouth AfricaSouth AsiaSouth Asia (IDA & IBRD)South SudanSpainSri LankaSt. Kitts and NevisSt. LuciaSt. Vincent and the GrenadinesSub-Saharan Africa Sub-Saharan Africa (excluding high income)Sub-Saharan Africa (IDA & IBRD countries)SudanSurinameSwazilandSwedenSwitzerlandSyrian Arab RepublicTajikistanTanzaniaThailandTimor-LesteTogoTongaTrinidad and TobagoTunisiaTurkeyTurkmenistanTurks and Caicos IslandsTuvaluUgandaUkraineUnited Arab EmiratesUnited KingdomUnited StatesUpper middle incomeUruguayUzbekistanVanuatuVenezuela, RBVietnamVirgin Islands (U.S.)West Bank and GazaWorldYemen, Rep.ZambiaZimbabwe Timeline:
This timeline shows a graph from 1961 to 2016 of Greenland. No data until 1960. Number of actual observations by date: 56.
Source name:
World Development Indicators
Source organization:
World Bank Staff estimates based on United Nations, World Urbanization Prospects.
Categories, topics:
Climate Change, Urban Development
Last updated:
apr 23, 2017
Indicators value changes by year
Minimum:
-0.151
jan 1, 1978
At the date of observation
Value
Absolute change
Change from previous value
jan 1, 1961
5.622
+5.622
0.0%
jan 1, 1962
5.775
+0.153
2.73%
jan 1, 1963
6.423
+0.648
11.22%
jan 1, 1964
6.459
+0.036
0.56%
jan 1, 1965
5.676
-0.783
-12.12%
jan 1, 1966
6.49
+0.814
14.33%
jan 1, 1967
5.42
-1.07
-16.49%
jan 1, 1968
5.394
-0.025
-0.47%
jan 1, 1969
5.437
+0.043
0.79%
jan 1, 1970
5.225
-0.212
-3.9%
jan 1, 1971
5.037
-0.188
-3.61%
jan 1, 1972
2.652
-2.385
-47.35%
jan 1, 1973
2.634
-0.018
-0.68%
jan 1, 1974
1.763
-0.871
-33.05%
jan 1, 1975
1.336
-0.428
-24.25%
jan 1, 1976
0.522
-0.814
-60.94%
jan 1, 1977
0.519
-0.003
-0.52%
jan 1, 1978
-0.151
-0.67
-129.11%
jan 1, 1979
0.113
+0.264
-175.01%
jan 1, 1980
1.318
+1.205
1.06K%
jan 1, 1981
1.705
+0.387
29.33%
jan 1, 1982
2.072
+0.367
21.52%
jan 1, 1983
1.463
-0.609
-29.38%
jan 1, 1984
1.634
+0.17
11.65%
jan 1, 1985
1.617
-0.016
-1.01%
jan 1, 1986
1.406
-0.211
-13.06%
jan 1, 1987
1.019
-0.386
-27.48%
jan 1, 1988
1.561
+0.541
53.07%
jan 1, 1989
1.728
+0.168
10.76%
jan 1, 1990
1.342
-0.386
-22.36%
jan 1, 1991
0.966
-0.376
-28.01%
jan 1, 1992
0.239
-0.727
-75.27%
jan 1, 1993
-0.027
-0.266
-111.31%
jan 1, 1994
0.072
+0.099
-366.61%
jan 1, 1995
0.789
+0.717
995.27%
jan 1, 1996
0.785
-0.004
-0.5%
jan 1, 1997
0.424
-0.361
-45.94%
jan 1, 1998
0.335
-0.09
-21.13%
jan 1, 1999
0.331
-0.003
-0.99%
jan 1, 2000
0.153
-0.178
-53.75%
jan 1, 2001
0.33
+0.177
115.19%
jan 1, 2002
0.572
+0.242
73.39%
jan 1, 2003
0.758
+0.186
32.58%
jan 1, 2004
0.571
-0.187
-24.72%
jan 1, 2005
0.55
-0.02
-3.55%
jan 1, 2006
0.378
-0.172
-31.33%
jan 1, 2007
0.095
-0.283
-74.78%
jan 1, 2008
-0.015
-0.11
-115.55%
jan 1, 2009
-0.036
-0.021
142.92%
jan 1, 2010
0.347
+0.383
-1.06K%
jan 1, 2011
1.38
+1.033
297.77%
jan 1, 2012
0.414
-0.966
-70.03%
jan 1, 2013
0.383
-0.031
-7.4%
jan 1, 2014
-0.07
-0.453
-118.35%
jan 1, 2015
0.147
+0.217
-308.74%
jan 1, 2016
0.132
-0.015
-9.98%
Ranking of countries by current statistics by years


Comments: