29
/
en
AIzaSyAYiBZKx7MnpbEhh9jyipgxe19OcubqV5w
April 1, 2024
243264
Slovenia
SVN
true
2
1
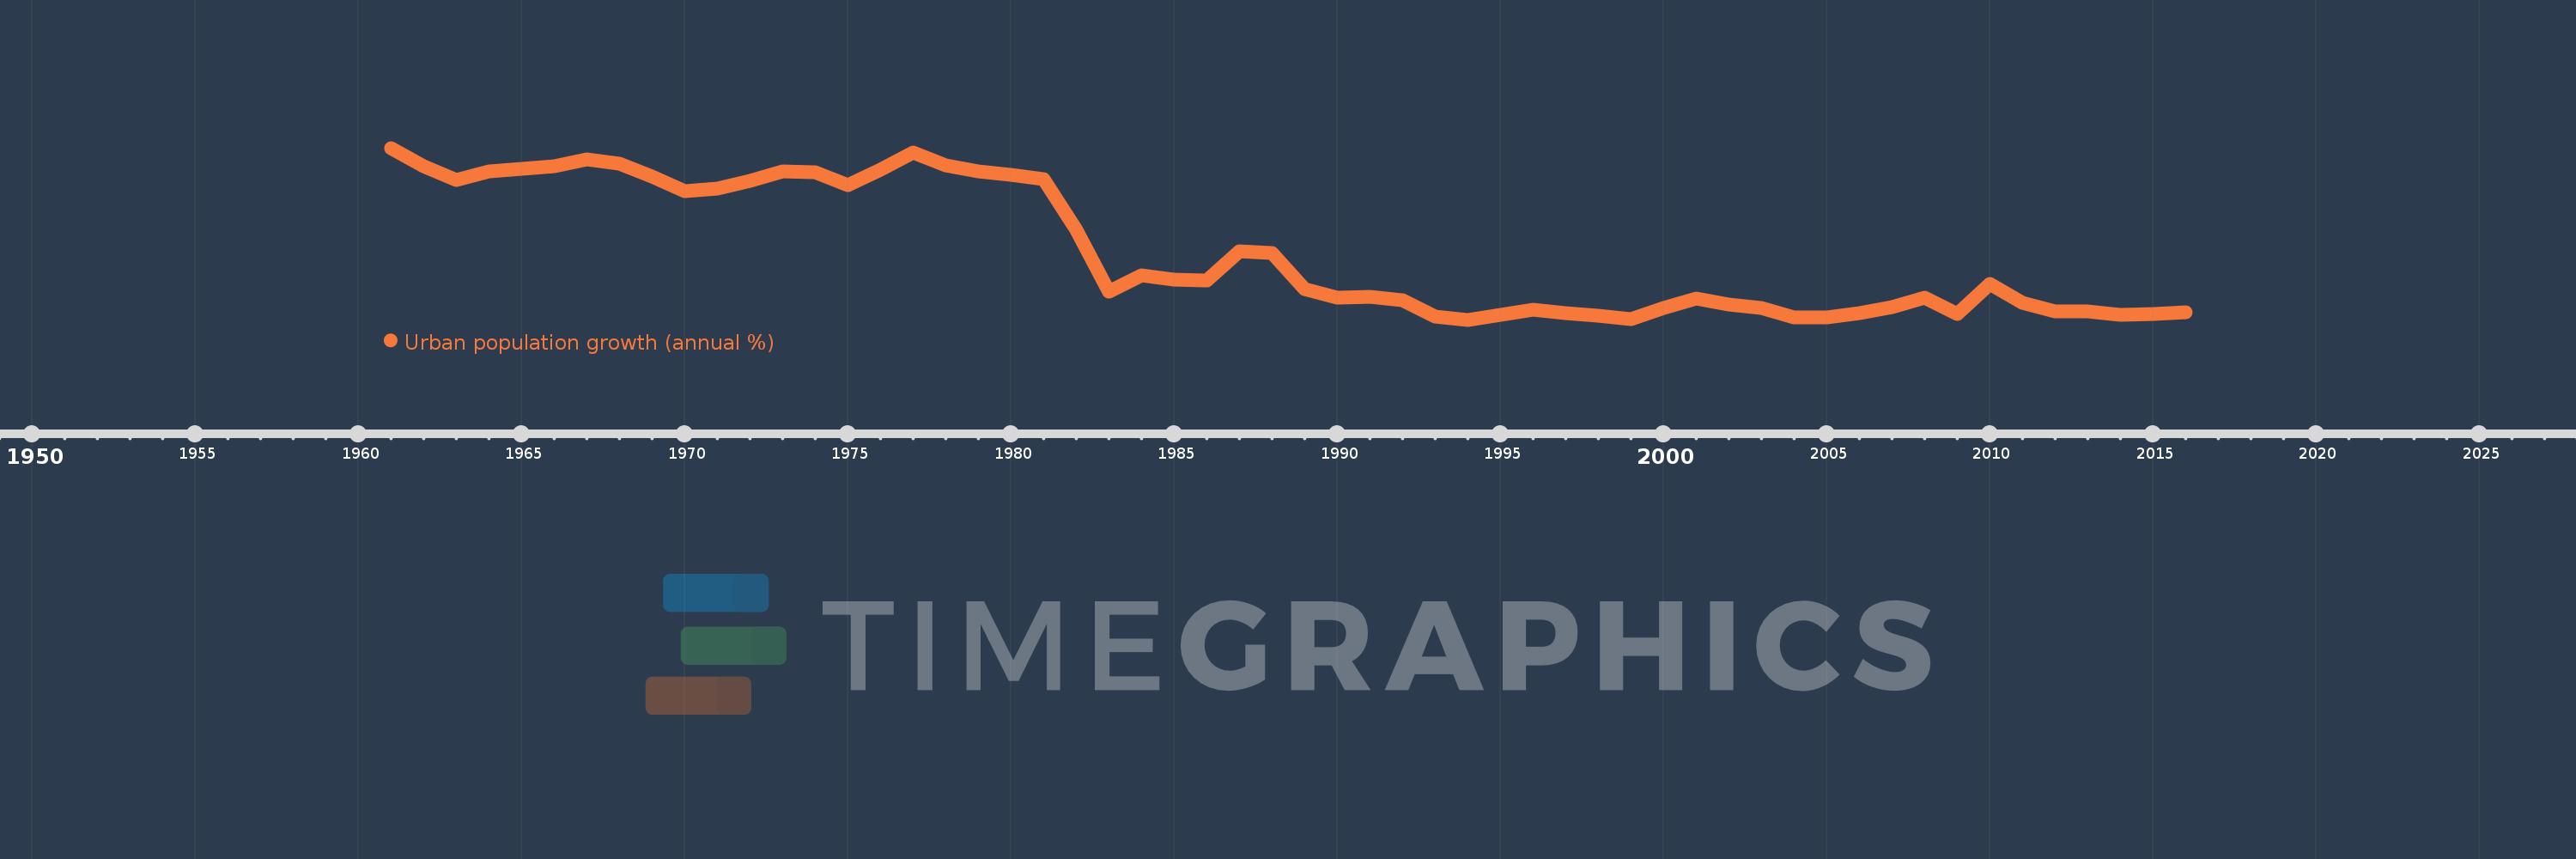
Urban population growth (annual %)
2016,2015,2014,2013,2012,2011,2010,2009,2008,2007,2006,2005,2004,2003,2002,2001,2000,1999,1998,1997,1996,1995,1994,1993,1992,1991,1990,1989,1988,1987,1986,1985,1984,1983,1982,1981,1980,1979,1978,1977,1976,1975,1974,1973,1972,1971,1970,1969,1968,1967,1966,1965,1964,1963,1962,1961
This statistics in other country:
AfghanistanAlbaniaAlgeriaAmerican SamoaAndorraAngolaAntigua and BarbudaArab WorldArgentinaArmeniaArubaAustraliaAustriaAzerbaijanBahamas, TheBahrainBangladeshBarbadosBelarusBelgiumBelizeBeninBermudaBhutanBoliviaBosnia and HerzegovinaBotswanaBrazilBritish Virgin IslandsBrunei DarussalamBulgariaBurkina FasoBurundiCabo VerdeCambodiaCameroonCanadaCaribbean small statesCayman IslandsCentral African RepublicCentral Europe and the BalticsChadChannel IslandsChileChinaColombiaComorosCongo, Dem. Rep.Congo, Rep.Costa RicaCote d'IvoireCroatiaCubaCuracaoCyprusCzech RepublicDenmarkDjiboutiDominicaDominican RepublicEarly-demographic dividendEast Asia & PacificEast Asia & Pacific (excluding high income)East Asia & Pacific (IDA & IBRD countries)EcuadorEgypt, Arab Rep.El SalvadorEquatorial GuineaEritreaEstoniaEthiopiaEuro areaEurope & Central AsiaEurope & Central Asia (excluding high income)Europe & Central Asia (IDA & IBRD countries)European UnionFaroe IslandsFijiFinlandFragile and conflict affected situationsFranceFrench PolynesiaGabonGambia, TheGeorgiaGermanyGhanaGibraltarGreeceGreenlandGrenadaGuamGuatemalaGuineaGuinea-BissauGuyanaHaitiHeavily indebted poor countries (HIPC)High incomeHondurasHong Kong SAR, ChinaHungaryIBRD onlyIcelandIDA & IBRD totalIDA blendIDA onlyIDA totalIndiaIndonesiaIran, Islamic Rep.IraqIrelandIsle of ManIsraelItalyJamaicaJapanJordanKazakhstanKenyaKiribatiKorea, Dem. People’s Rep.Korea, Rep.KuwaitKyrgyz RepublicLao PDRLate-demographic dividendLatin America & Caribbean Latin America & Caribbean (excluding high income)Latin America & the Caribbean (IDA & IBRD countries)LatviaLeast developed countries: UN classificationLebanonLesothoLiberiaLibyaLiechtensteinLithuaniaLow & middle incomeLow incomeLower middle incomeLuxembourgMacao SAR, ChinaMacedonia, FYRMadagascarMalawiMalaysiaMaldivesMaliMaltaMarshall IslandsMauritaniaMauritiusMexicoMicronesia, Fed. Sts.Middle East & North AfricaMiddle East & North Africa (excluding high income)Middle East & North Africa (IDA & IBRD countries)Middle incomeMoldovaMonacoMongoliaMontenegroMoroccoMozambiqueMyanmarNamibiaNauruNepalNetherlandsNew CaledoniaNew ZealandNicaraguaNigerNigeriaNorth AmericaNorthern Mariana IslandsNorwayOECD membersOmanOther small statesPacific island small statesPakistanPalauPanamaPapua New GuineaParaguayPeruPhilippinesPolandPortugalPost-demographic dividendPre-demographic dividendPuerto RicoQatarRomaniaRussian FederationRwandaSamoaSan MarinoSao Tome and PrincipeSaudi ArabiaSenegalSerbiaSeychellesSierra LeoneSingaporeSint Maarten (Dutch part)Slovak RepublicSloveniaSmall statesSolomon IslandsSomaliaSouth AfricaSouth AsiaSouth Asia (IDA & IBRD)South SudanSpainSri LankaSt. Kitts and NevisSt. LuciaSt. Vincent and the GrenadinesSub-Saharan Africa Sub-Saharan Africa (excluding high income)Sub-Saharan Africa (IDA & IBRD countries)SudanSurinameSwazilandSwedenSwitzerlandSyrian Arab RepublicTajikistanTanzaniaThailandTimor-LesteTogoTongaTrinidad and TobagoTunisiaTurkeyTurkmenistanTurks and Caicos IslandsTuvaluUgandaUkraineUnited Arab EmiratesUnited KingdomUnited StatesUpper middle incomeUruguayUzbekistanVanuatuVenezuela, RBVietnamVirgin Islands (U.S.)West Bank and GazaWorldYemen, Rep.ZambiaZimbabwe Timeline:
This timeline shows a graph from 1961 to 2016 of Slovenia. No data until 1960. Number of actual observations by date: 56.
Source name:
World Development Indicators
Source organization:
World Bank Staff estimates based on United Nations, World Urbanization Prospects.
Categories, topics:
Climate Change, Urban Development
Last updated:
apr 23, 2017
Indicators value changes by year
Minimum:
-0.185
jan 1, 1994
At the date of observation
Value
Absolute change
Change from previous value
jan 1, 1961
4.207
+4.207
0.0%
jan 1, 1962
3.744
-0.463
-11.01%
jan 1, 1963
3.397
-0.347
-9.27%
jan 1, 1964
3.601
+0.205
6.02%
jan 1, 1965
3.672
+0.071
1.97%
jan 1, 1966
3.74
+0.068
1.84%
jan 1, 1967
3.919
+0.179
4.78%
jan 1, 1968
3.8
-0.119
-3.03%
jan 1, 1969
3.486
-0.314
-8.26%
jan 1, 1970
3.106
-0.38
-10.91%
jan 1, 1971
3.167
+0.061
1.96%
jan 1, 1972
3.359
+0.192
6.06%
jan 1, 1973
3.616
+0.257
7.66%
jan 1, 1974
3.587
-0.029
-0.8%
jan 1, 1975
3.25
-0.337
-9.4%
jan 1, 1976
3.644
+0.394
12.14%
jan 1, 1977
4.096
+0.452
12.4%
jan 1, 1978
3.769
-0.328
-8.0%
jan 1, 1979
3.6
-0.168
-4.46%
jan 1, 1980
3.529
-0.071
-1.97%
jan 1, 1981
3.399
-0.13
-3.69%
jan 1, 1982
2.12
-1.28
-37.64%
jan 1, 1983
0.526
-1.594
-75.2%
jan 1, 1984
0.951
+0.425
80.87%
jan 1, 1985
0.835
-0.116
-12.23%
jan 1, 1986
0.813
-0.022
-2.58%
jan 1, 1987
1.567
+0.754
92.74%
jan 1, 1988
1.525
-0.042
-2.67%
jan 1, 1989
0.594
-0.931
-61.04%
jan 1, 1990
0.375
-0.219
-36.9%
jan 1, 1991
0.409
+0.034
9.03%
jan 1, 1992
0.315
-0.094
-22.9%
jan 1, 1993
-0.093
-0.409
-129.61%
jan 1, 1994
-0.185
-0.092
98.05%
jan 1, 1995
-0.06
+0.124
-67.32%
jan 1, 1996
0.075
+0.135
-224.17%
jan 1, 1997
-0.009
-0.084
-112.31%
jan 1, 1998
-0.079
-0.07
757.37%
jan 1, 1999
-0.165
-0.086
108.28%
jan 1, 2000
0.125
+0.29
-175.65%
jan 1, 2001
0.349
+0.224
179.96%
jan 1, 2002
0.213
-0.137
-39.1%
jan 1, 2003
0.118
-0.095
-44.53%
jan 1, 2004
-0.121
-0.239
-202.6%
jan 1, 2005
-0.118
+0.003
-2.82%
jan 1, 2006
-0.009
+0.109
-92.51%
jan 1, 2007
0.137
+0.146
-1.65K%
jan 1, 2008
0.376
+0.24
175.21%
jan 1, 2009
-0.027
-0.403
-107.12%
jan 1, 2010
0.722
+0.749
-2.8K%
jan 1, 2011
0.25
-0.472
-65.34%
jan 1, 2012
0.024
-0.227
-90.54%
jan 1, 2013
0.026
+0.002
8.2%
jan 1, 2014
-0.049
-0.075
-290.9%
jan 1, 2015
-0.04
+0.009
-17.49%
jan 1, 2016
-0.004
+0.036
-90.34%
Ranking of countries by current statistics by years


Comments: