29
/
en
AIzaSyAYiBZKx7MnpbEhh9jyipgxe19OcubqV5w
April 1, 2024
200012
Mongolia
MNG
true
2
1
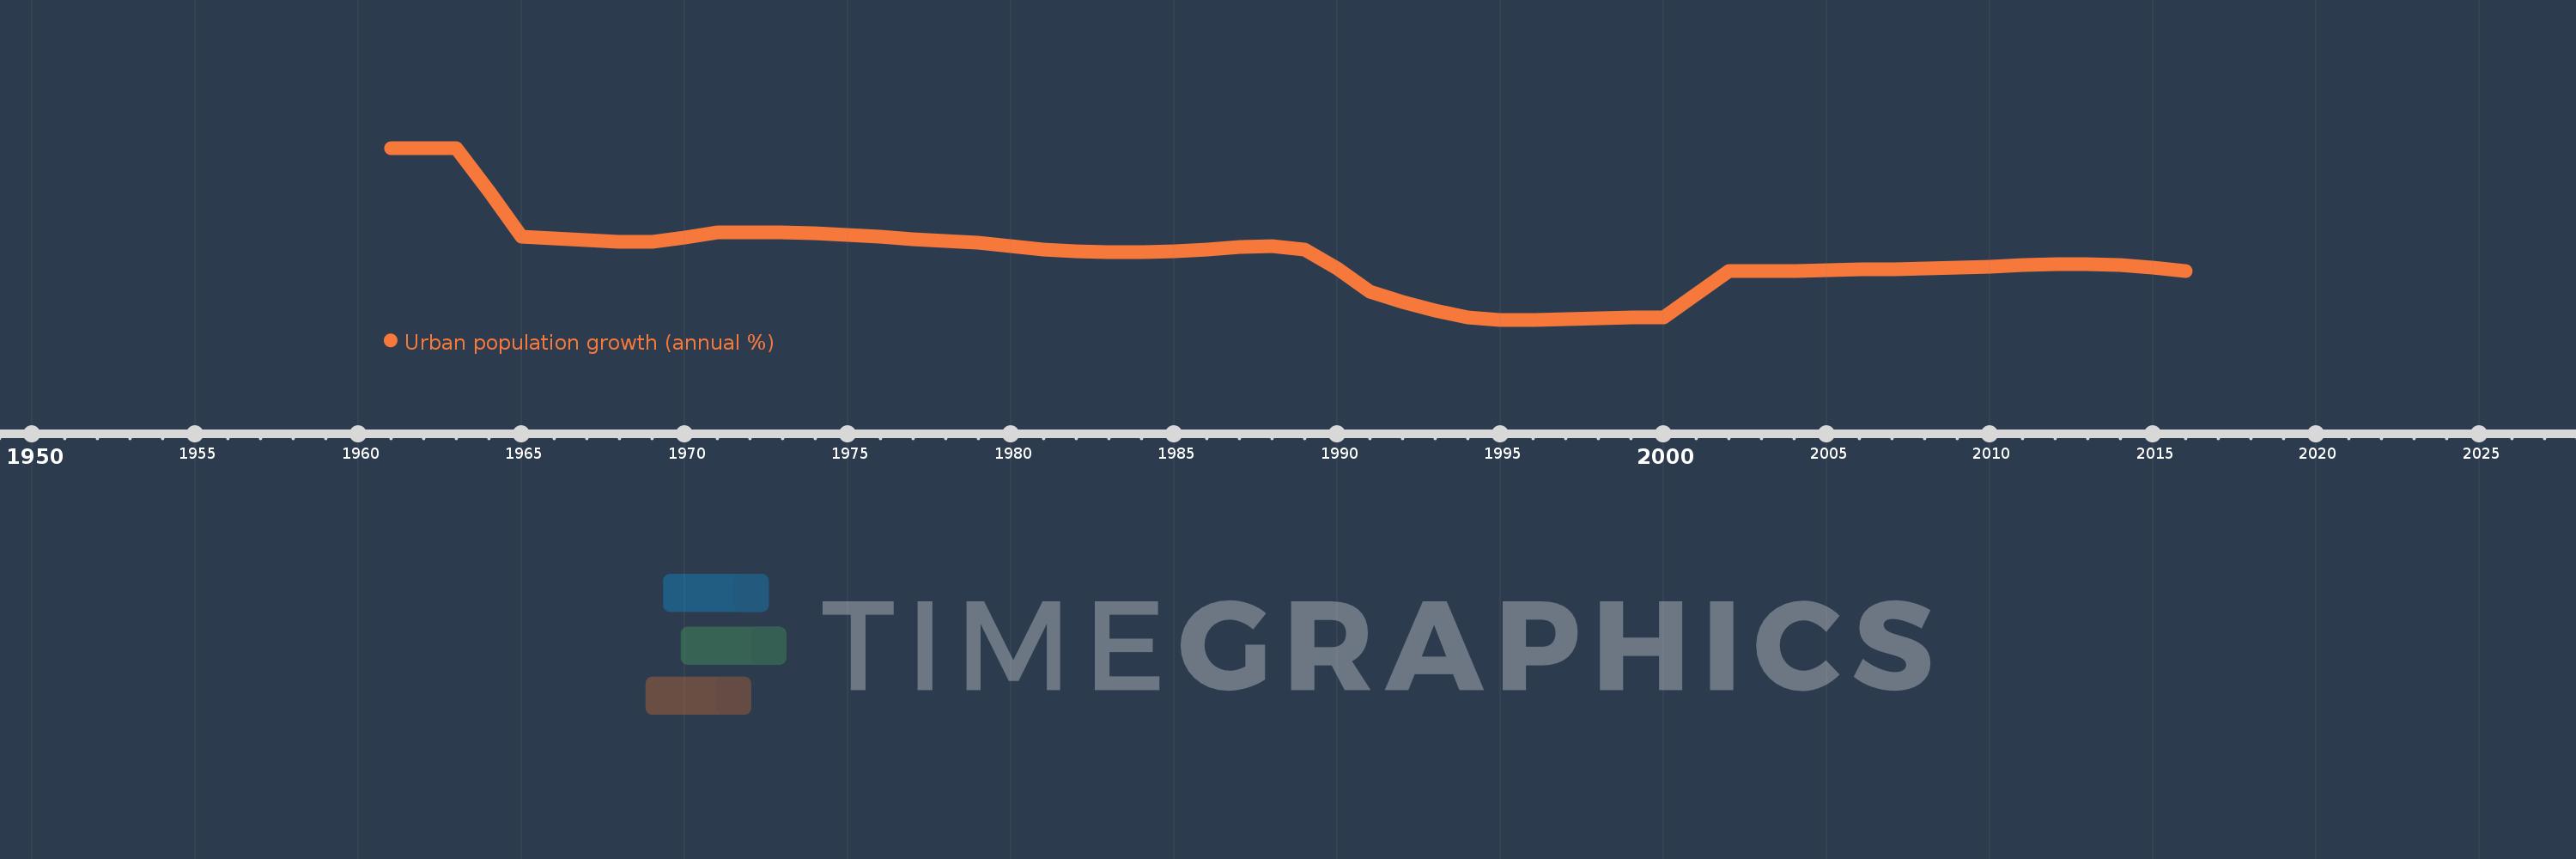
Urban population growth (annual %)
2016,2015,2014,2013,2012,2011,2010,2009,2008,2007,2006,2005,2004,2003,2002,2001,2000,1999,1998,1997,1996,1995,1994,1993,1992,1991,1990,1989,1988,1987,1986,1985,1984,1983,1982,1981,1980,1979,1978,1977,1976,1975,1974,1973,1972,1971,1970,1969,1968,1967,1966,1965,1964,1963,1962,1961
This statistics in other country:
AfghanistanAlbaniaAlgeriaAmerican SamoaAndorraAngolaAntigua and BarbudaArab WorldArgentinaArmeniaArubaAustraliaAustriaAzerbaijanBahamas, TheBahrainBangladeshBarbadosBelarusBelgiumBelizeBeninBermudaBhutanBoliviaBosnia and HerzegovinaBotswanaBrazilBritish Virgin IslandsBrunei DarussalamBulgariaBurkina FasoBurundiCabo VerdeCambodiaCameroonCanadaCaribbean small statesCayman IslandsCentral African RepublicCentral Europe and the BalticsChadChannel IslandsChileChinaColombiaComorosCongo, Dem. Rep.Congo, Rep.Costa RicaCote d'IvoireCroatiaCubaCuracaoCyprusCzech RepublicDenmarkDjiboutiDominicaDominican RepublicEarly-demographic dividendEast Asia & PacificEast Asia & Pacific (excluding high income)East Asia & Pacific (IDA & IBRD countries)EcuadorEgypt, Arab Rep.El SalvadorEquatorial GuineaEritreaEstoniaEthiopiaEuro areaEurope & Central AsiaEurope & Central Asia (excluding high income)Europe & Central Asia (IDA & IBRD countries)European UnionFaroe IslandsFijiFinlandFragile and conflict affected situationsFranceFrench PolynesiaGabonGambia, TheGeorgiaGermanyGhanaGibraltarGreeceGreenlandGrenadaGuamGuatemalaGuineaGuinea-BissauGuyanaHaitiHeavily indebted poor countries (HIPC)High incomeHondurasHong Kong SAR, ChinaHungaryIBRD onlyIcelandIDA & IBRD totalIDA blendIDA onlyIDA totalIndiaIndonesiaIran, Islamic Rep.IraqIrelandIsle of ManIsraelItalyJamaicaJapanJordanKazakhstanKenyaKiribatiKorea, Dem. People’s Rep.Korea, Rep.KuwaitKyrgyz RepublicLao PDRLate-demographic dividendLatin America & Caribbean Latin America & Caribbean (excluding high income)Latin America & the Caribbean (IDA & IBRD countries)LatviaLeast developed countries: UN classificationLebanonLesothoLiberiaLibyaLiechtensteinLithuaniaLow & middle incomeLow incomeLower middle incomeLuxembourgMacao SAR, ChinaMacedonia, FYRMadagascarMalawiMalaysiaMaldivesMaliMaltaMarshall IslandsMauritaniaMauritiusMexicoMicronesia, Fed. Sts.Middle East & North AfricaMiddle East & North Africa (excluding high income)Middle East & North Africa (IDA & IBRD countries)Middle incomeMoldovaMonacoMongoliaMontenegroMoroccoMozambiqueMyanmarNamibiaNauruNepalNetherlandsNew CaledoniaNew ZealandNicaraguaNigerNigeriaNorth AmericaNorthern Mariana IslandsNorwayOECD membersOmanOther small statesPacific island small statesPakistanPalauPanamaPapua New GuineaParaguayPeruPhilippinesPolandPortugalPost-demographic dividendPre-demographic dividendPuerto RicoQatarRomaniaRussian FederationRwandaSamoaSan MarinoSao Tome and PrincipeSaudi ArabiaSenegalSerbiaSeychellesSierra LeoneSingaporeSint Maarten (Dutch part)Slovak RepublicSloveniaSmall statesSolomon IslandsSomaliaSouth AfricaSouth AsiaSouth Asia (IDA & IBRD)South SudanSpainSri LankaSt. Kitts and NevisSt. LuciaSt. Vincent and the GrenadinesSub-Saharan Africa Sub-Saharan Africa (excluding high income)Sub-Saharan Africa (IDA & IBRD countries)SudanSurinameSwazilandSwedenSwitzerlandSyrian Arab RepublicTajikistanTanzaniaThailandTimor-LesteTogoTongaTrinidad and TobagoTunisiaTurkeyTurkmenistanTurks and Caicos IslandsTuvaluUgandaUkraineUnited Arab EmiratesUnited KingdomUnited StatesUpper middle incomeUruguayUzbekistanVanuatuVenezuela, RBVietnamVirgin Islands (U.S.)West Bank and GazaWorldYemen, Rep.ZambiaZimbabwe Timeline:
This timeline shows a graph from 1961 to 2016 of Mongolia. No data until 1960. Number of actual observations by date: 56.
Source name:
World Development Indicators
Source organization:
World Bank Staff estimates based on United Nations, World Urbanization Prospects.
Categories, topics:
Climate Change, Urban Development
Last updated:
apr 23, 2017
Indicators value changes by year
At the date of observation
Value
Absolute change
Change from previous value
jan 1, 1961
8.194
+8.194
0.0%
jan 1, 1962
8.214
+0.02
0.25%
jan 1, 1963
8.217
+0.003
0.03%
jan 1, 1964
6.308
-1.91
-23.24%
jan 1, 1965
4.316
-1.991
-31.57%
jan 1, 1966
4.254
-0.063
-1.45%
jan 1, 1967
4.18
-0.073
-1.72%
jan 1, 1968
4.117
-0.063
-1.51%
jan 1, 1969
4.084
-0.033
-0.8%
jan 1, 1970
4.273
+0.189
4.62%
jan 1, 1971
4.507
+0.234
5.47%
jan 1, 1972
4.526
+0.02
0.44%
jan 1, 1973
4.527
+0.001
0.01%
jan 1, 1974
4.488
-0.039
-0.86%
jan 1, 1975
4.418
-0.07
-1.57%
jan 1, 1976
4.323
-0.095
-2.15%
jan 1, 1977
4.226
-0.097
-2.24%
jan 1, 1978
4.134
-0.092
-2.19%
jan 1, 1979
4.069
-0.065
-1.58%
jan 1, 1980
3.9
-0.168
-4.14%
jan 1, 1981
3.747
-0.153
-3.93%
jan 1, 1982
3.695
-0.052
-1.4%
jan 1, 1983
3.638
-0.056
-1.53%
jan 1, 1984
3.632
-0.006
-0.18%
jan 1, 1985
3.685
+0.053
1.46%
jan 1, 1986
3.753
+0.068
1.84%
jan 1, 1987
3.855
+0.102
2.73%
jan 1, 1988
3.895
+0.04
1.03%
jan 1, 1989
3.77
-0.125
-3.21%
jan 1, 1990
2.913
-0.857
-22.73%
jan 1, 1991
1.916
-0.997
-34.22%
jan 1, 1992
1.454
-0.462
-24.12%
jan 1, 1993
1.068
-0.386
-26.54%
jan 1, 1994
0.793
-0.275
-25.71%
jan 1, 1995
0.682
-0.111
-14.05%
jan 1, 1996
0.685
+0.003
0.5%
jan 1, 1997
0.724
+0.039
5.65%
jan 1, 1998
0.741
+0.017
2.34%
jan 1, 1999
0.769
+0.028
3.75%
jan 1, 2000
0.789
+0.02
2.57%
jan 1, 2001
1.788
+0.999
126.73%
jan 1, 2002
2.814
+1.026
57.37%
jan 1, 2003
2.819
+0.005
0.19%
jan 1, 2004
2.835
+0.016
0.56%
jan 1, 2005
2.859
+0.025
0.86%
jan 1, 2006
2.884
+0.024
0.85%
jan 1, 2007
2.912
+0.028
0.99%
jan 1, 2008
2.938
+0.026
0.89%
jan 1, 2009
2.976
+0.038
1.28%
jan 1, 2010
3.018
+0.042
1.42%
jan 1, 2011
3.073
+0.055
1.81%
jan 1, 2012
3.124
+0.051
1.66%
jan 1, 2013
3.123
0.0
-0.01%
jan 1, 2014
3.073
-0.051
-1.63%
jan 1, 2015
2.967
-0.106
-3.44%
jan 1, 2016
2.821
-0.146
-4.92%
Ranking of countries by current statistics by years


Comments: