29
/
en
AIzaSyAYiBZKx7MnpbEhh9jyipgxe19OcubqV5w
April 1, 2024
95020
Burkina Faso
BFA
true
2
1
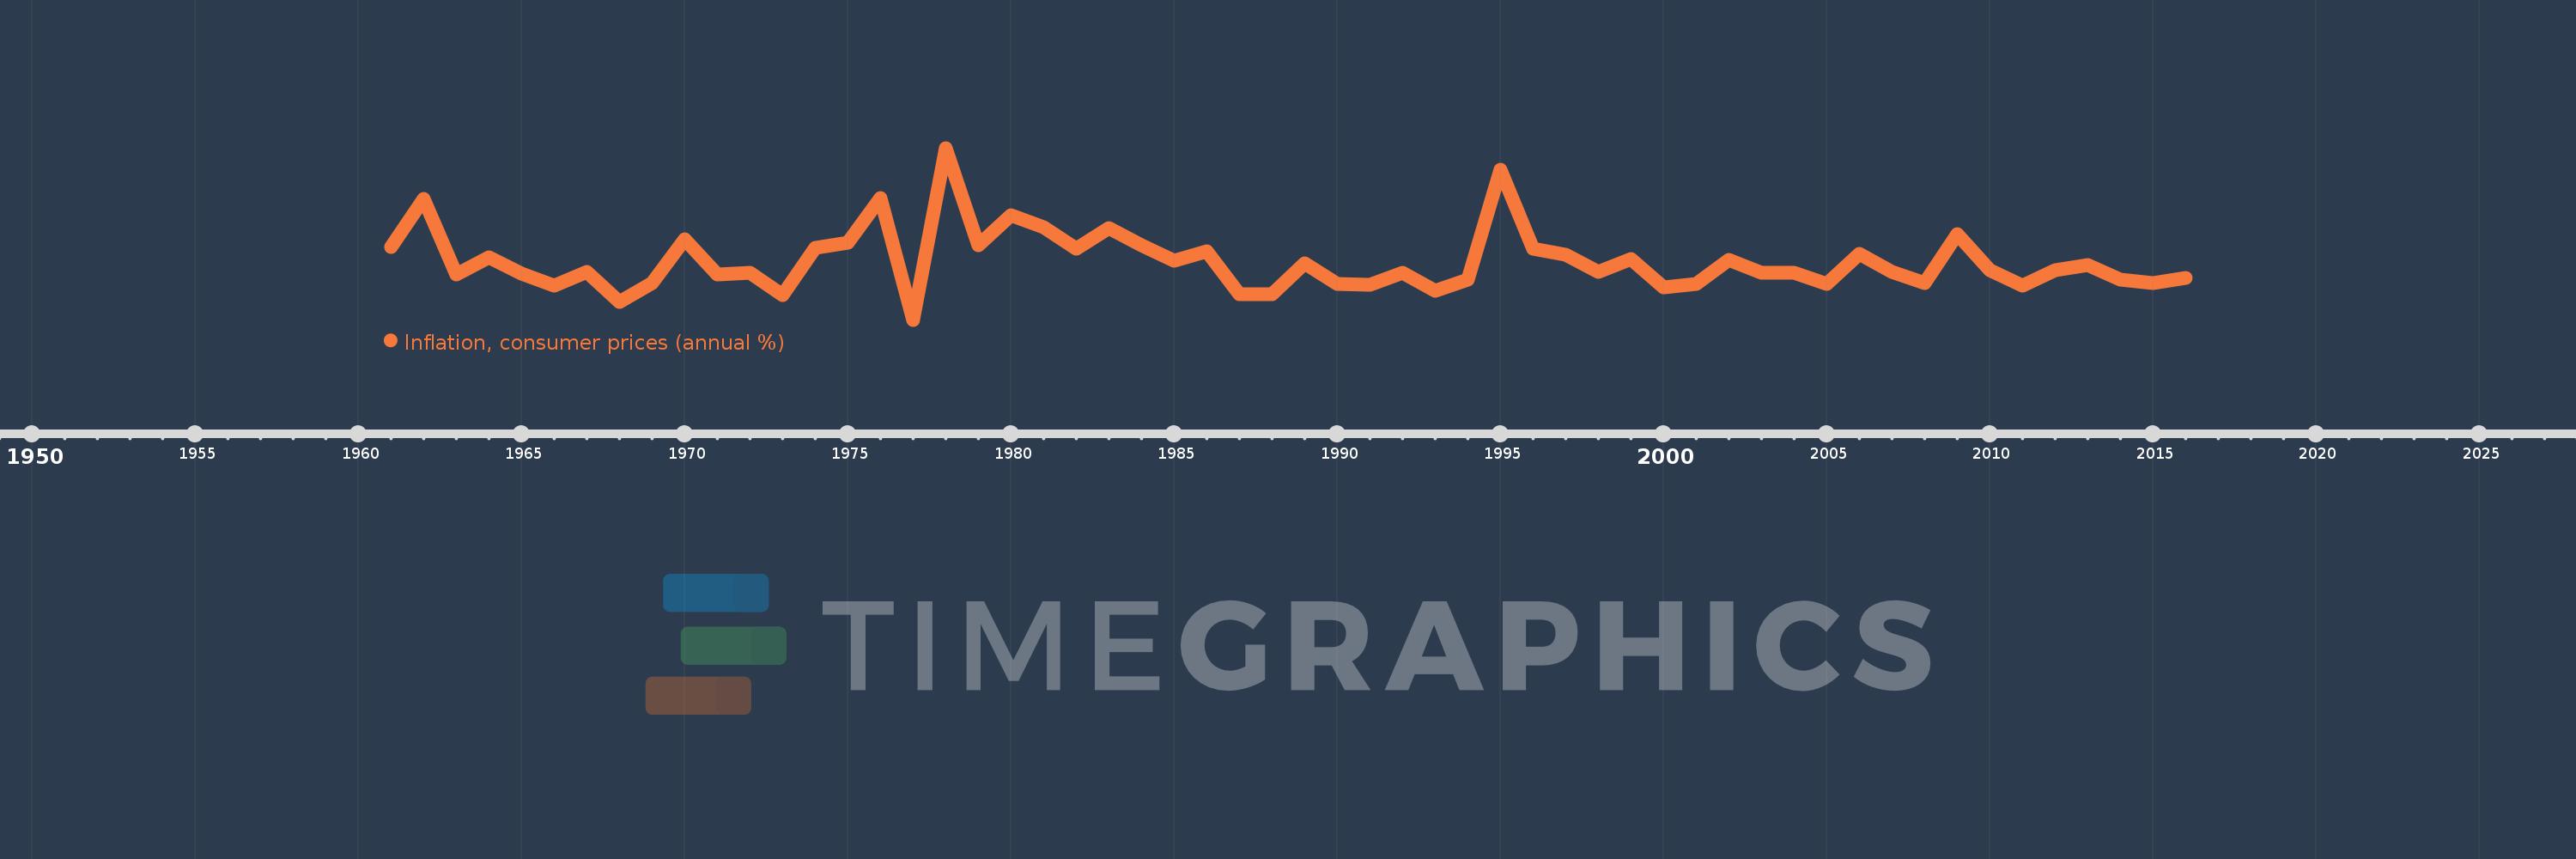
Inflation, consumer prices (annual %)
2016,2015,2014,2013,2012,2011,2010,2009,2008,2007,2006,2005,2004,2003,2002,2001,2000,1999,1998,1997,1996,1995,1994,1993,1992,1991,1990,1989,1988,1987,1986,1985,1984,1983,1982,1981,1980,1979,1978,1977,1976,1975,1974,1973,1972,1971,1970,1969,1968,1967,1966,1965,1964,1963,1962,1961
This statistics in other country:
AfghanistanAlbaniaAlgeriaAngolaAntigua and BarbudaArab WorldArgentinaArmeniaArubaAustraliaAustriaAzerbaijanBahamas, TheBahrainBangladeshBarbadosBelarusBelgiumBelizeBeninBhutanBoliviaBotswanaBrazilBrunei DarussalamBulgariaBurkina FasoBurundiCabo VerdeCambodiaCameroonCanadaCaribbean small statesCentral African RepublicCentral Europe and the BalticsChadChileChinaColombiaComorosCongo, Dem. Rep.Congo, Rep.Costa RicaCote d'IvoireCroatiaCyprusCzech RepublicDenmarkDjiboutiDominicaDominican RepublicEarly-demographic dividendEast Asia & PacificEast Asia & Pacific (excluding high income)East Asia & Pacific (IDA & IBRD countries)EcuadorEgypt, Arab Rep.El SalvadorEquatorial GuineaEstoniaEthiopiaEuro areaEurope & Central AsiaEurope & Central Asia (excluding high income)Europe & Central Asia (IDA & IBRD countries)European UnionFijiFinlandFragile and conflict affected situationsFranceGabonGambia, TheGeorgiaGermanyGhanaGreeceGrenadaGuatemalaGuineaGuinea-BissauGuyanaHaitiHeavily indebted poor countries (HIPC)High incomeHondurasHong Kong SAR, ChinaHungaryIBRD onlyIcelandIDA & IBRD totalIDA blendIDA onlyIDA totalIndiaIndonesiaIran, Islamic Rep.IraqIrelandIsraelItalyJamaicaJapanJordanKazakhstanKenyaKorea, Rep.KuwaitKyrgyz RepublicLao PDRLate-demographic dividendLatin America & Caribbean Latin America & Caribbean (excluding high income)Latin America & the Caribbean (IDA & IBRD countries)LatviaLeast developed countries: UN classificationLebanonLesothoLiberiaLibyaLithuaniaLow & middle incomeLow incomeLower middle incomeLuxembourgMacao SAR, ChinaMacedonia, FYRMadagascarMalawiMalaysiaMaldivesMaliMaltaMauritaniaMauritiusMexicoMiddle East & North AfricaMiddle East & North Africa (excluding high income)Middle East & North Africa (IDA & IBRD countries)Middle incomeMoldovaMongoliaMontenegroMoroccoMozambiqueMyanmarNamibiaNepalNetherlandsNew ZealandNicaraguaNigerNigeriaNorth AmericaNorwayOECD membersOmanOther small statesPakistanPanamaPapua New GuineaParaguayPeruPhilippinesPolandPortugalPost-demographic dividendPre-demographic dividendQatarRomaniaRussian FederationRwandaSamoaSao Tome and PrincipeSaudi ArabiaSenegalSerbiaSeychellesSierra LeoneSingaporeSlovak RepublicSloveniaSmall statesSolomon IslandsSouth AfricaSouth AsiaSouth Asia (IDA & IBRD)South SudanSpainSri LankaSt. Kitts and NevisSt. LuciaSt. Vincent and the GrenadinesSub-Saharan Africa Sub-Saharan Africa (excluding high income)Sub-Saharan Africa (IDA & IBRD countries)SudanSurinameSwazilandSwedenSwitzerlandSyrian Arab RepublicTajikistanTanzaniaThailandTimor-LesteTogoTongaTrinidad and TobagoTunisiaTurkeyUgandaUkraineUnited KingdomUnited StatesUpper middle incomeUruguayVanuatuVenezuela, RBVietnamWorldYemen, Rep.ZambiaZimbabwe Timeline:
This timeline shows a graph from 1961 to 2016 of Burkina Faso. No data until 1960. Number of actual observations by date: 56.
Source name:
World Development Indicators
Source organization:
International Monetary Fund, International Financial Statistics and data files.
Categories, topics:
Economy & Growth, Financial Sector
Last updated:
apr 23, 2017
Indicators value changes by year
Minimum:
-8.401
jan 1, 1977
Maximum:
29.986
jan 1, 1978
At the date of observation
Value
Absolute change
Change from previous value
jan 1, 1961
7.788
+7.788
0.0%
jan 1, 1962
18.562
+10.774
138.34%
jan 1, 1963
1.676
-16.886
-90.97%
jan 1, 1964
5.574
+3.898
232.61%
jan 1, 1965
1.845
-3.729
-66.9%
jan 1, 1966
-0.73
-2.575
-139.58%
jan 1, 1967
2.364
+3.094
-423.74%
jan 1, 1968
-4.334
-6.698
-283.31%
jan 1, 1969
-0.287
+4.047
-93.38%
jan 1, 1970
9.656
+9.942
-3.47K%
jan 1, 1971
1.773
-7.883
-81.64%
jan 1, 1972
2.061
+0.289
16.28%
jan 1, 1973
-2.923
-4.985
-241.83%
jan 1, 1974
7.604
+10.527
-360.11%
jan 1, 1975
8.72
+1.116
14.67%
jan 1, 1976
18.757
+10.037
115.11%
jan 1, 1977
-8.401
-27.158
-144.79%
jan 1, 1978
29.986
+38.387
-456.95%
jan 1, 1979
8.269
-21.717
-72.42%
jan 1, 1980
14.993
+6.724
81.32%
jan 1, 1981
12.203
-2.791
-18.61%
jan 1, 1982
7.556
-4.647
-38.08%
jan 1, 1983
12.06
+4.504
59.61%
jan 1, 1984
8.154
-3.906
-32.39%
jan 1, 1985
4.847
-3.307
-40.56%
jan 1, 1986
6.906
+2.059
42.48%
jan 1, 1987
-2.612
-9.518
-137.82%
jan 1, 1988
-2.682
-0.07
2.68%
jan 1, 1989
4.256
+6.937
-258.69%
jan 1, 1990
-0.482
-4.737
-111.32%
jan 1, 1991
-0.504
-0.023
4.67%
jan 1, 1992
2.163
+2.667
-528.83%
jan 1, 1993
-1.991
-4.154
-192.07%
jan 1, 1994
0.553
+2.545
-127.8%
jan 1, 1995
25.178
+24.624
4.45K%
jan 1, 1996
7.459
-17.719
-70.38%
jan 1, 1997
6.098
-1.361
-18.25%
jan 1, 1998
2.319
-3.779
-61.97%
jan 1, 1999
5.084
+2.766
119.28%
jan 1, 2000
-1.073
-6.157
-121.1%
jan 1, 2001
-0.304
+0.768
-71.64%
jan 1, 2002
5.007
+5.312
-1.75K%
jan 1, 2003
2.176
-2.832
-56.55%
jan 1, 2004
2.035
-0.141
-6.49%
jan 1, 2005
-0.4
-2.435
-119.67%
jan 1, 2006
6.415
+6.815
-1.7K%
jan 1, 2007
2.333
-4.082
-63.63%
jan 1, 2008
-0.231
-2.564
-109.88%
jan 1, 2009
10.66
+10.89
-4.72K%
jan 1, 2010
2.608
-8.052
-75.53%
jan 1, 2011
-0.764
-3.372
-129.3%
jan 1, 2012
2.76
+3.524
-461.12%
jan 1, 2013
3.818
+1.058
38.35%
jan 1, 2014
0.534
-3.284
-86.02%
jan 1, 2015
-0.258
-0.792
-148.36%
jan 1, 2016
0.955
+1.213
-470.02%
Ranking of countries by current statistics by years


Comments: