29
/
en
AIzaSyAYiBZKx7MnpbEhh9jyipgxe19OcubqV5w
April 1, 2024
194380
Mauritius
MUS
true
2
1
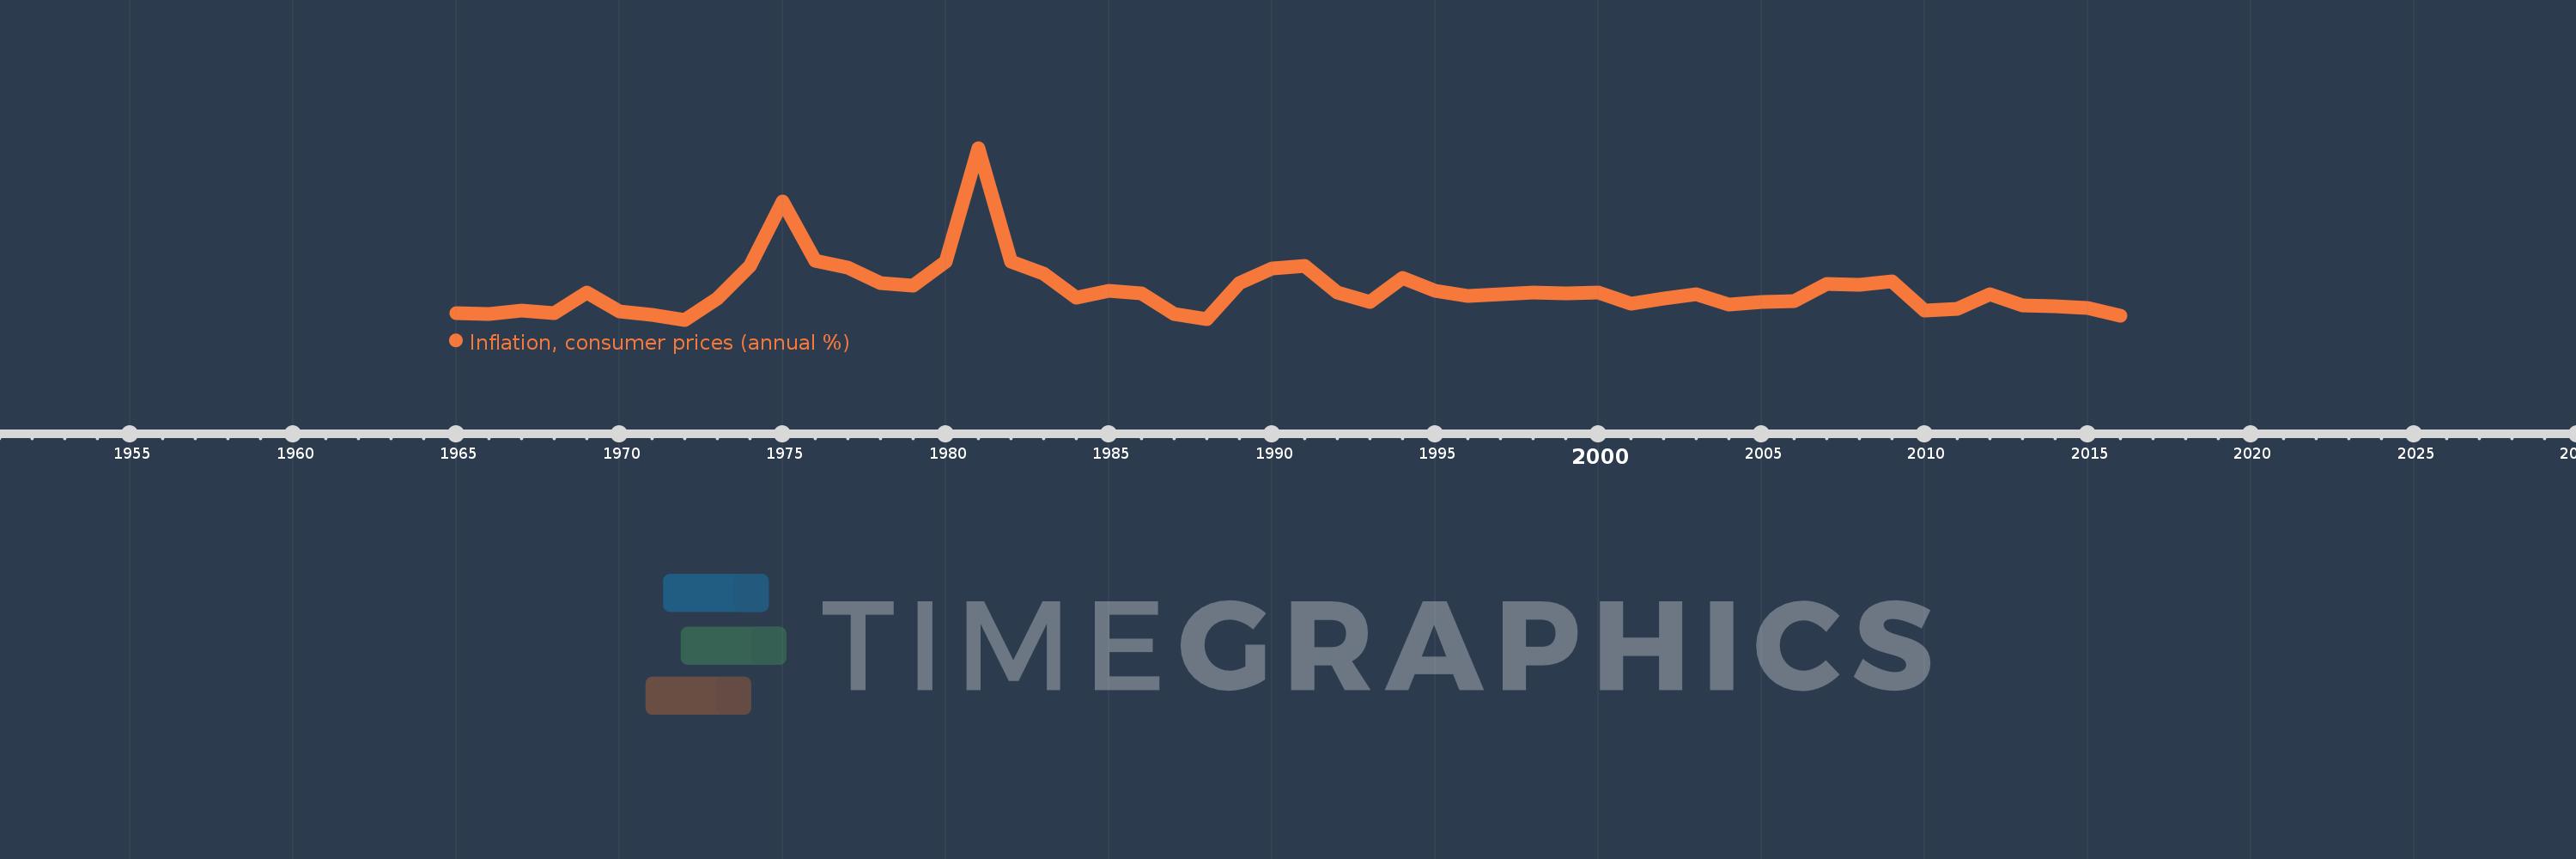
Inflation, consumer prices (annual %)
2016,2015,2014,2013,2012,2011,2010,2009,2008,2007,2006,2005,2004,2003,2002,2001,2000,1999,1998,1997,1996,1995,1994,1993,1992,1991,1990,1989,1988,1987,1986,1985,1984,1983,1982,1981,1980,1979,1978,1977,1976,1975,1974,1973,1972,1971,1970,1969,1968,1967,1966,1965
This statistics in other country:
AfghanistanAlbaniaAlgeriaAngolaAntigua and BarbudaArab WorldArgentinaArmeniaArubaAustraliaAustriaAzerbaijanBahamas, TheBahrainBangladeshBarbadosBelarusBelgiumBelizeBeninBhutanBoliviaBotswanaBrazilBrunei DarussalamBulgariaBurkina FasoBurundiCabo VerdeCambodiaCameroonCanadaCaribbean small statesCentral African RepublicCentral Europe and the BalticsChadChileChinaColombiaComorosCongo, Dem. Rep.Congo, Rep.Costa RicaCote d'IvoireCroatiaCyprusCzech RepublicDenmarkDjiboutiDominicaDominican RepublicEarly-demographic dividendEast Asia & PacificEast Asia & Pacific (excluding high income)East Asia & Pacific (IDA & IBRD countries)EcuadorEgypt, Arab Rep.El SalvadorEquatorial GuineaEstoniaEthiopiaEuro areaEurope & Central AsiaEurope & Central Asia (excluding high income)Europe & Central Asia (IDA & IBRD countries)European UnionFijiFinlandFragile and conflict affected situationsFranceGabonGambia, TheGeorgiaGermanyGhanaGreeceGrenadaGuatemalaGuineaGuinea-BissauGuyanaHaitiHeavily indebted poor countries (HIPC)High incomeHondurasHong Kong SAR, ChinaHungaryIBRD onlyIcelandIDA & IBRD totalIDA blendIDA onlyIDA totalIndiaIndonesiaIran, Islamic Rep.IraqIrelandIsraelItalyJamaicaJapanJordanKazakhstanKenyaKorea, Rep.KuwaitKyrgyz RepublicLao PDRLate-demographic dividendLatin America & Caribbean Latin America & Caribbean (excluding high income)Latin America & the Caribbean (IDA & IBRD countries)LatviaLeast developed countries: UN classificationLebanonLesothoLiberiaLibyaLithuaniaLow & middle incomeLow incomeLower middle incomeLuxembourgMacao SAR, ChinaMacedonia, FYRMadagascarMalawiMalaysiaMaldivesMaliMaltaMauritaniaMauritiusMexicoMiddle East & North AfricaMiddle East & North Africa (excluding high income)Middle East & North Africa (IDA & IBRD countries)Middle incomeMoldovaMongoliaMontenegroMoroccoMozambiqueMyanmarNamibiaNepalNetherlandsNew ZealandNicaraguaNigerNigeriaNorth AmericaNorwayOECD membersOmanOther small statesPakistanPanamaPapua New GuineaParaguayPeruPhilippinesPolandPortugalPost-demographic dividendPre-demographic dividendQatarRomaniaRussian FederationRwandaSamoaSao Tome and PrincipeSaudi ArabiaSenegalSerbiaSeychellesSierra LeoneSingaporeSlovak RepublicSloveniaSmall statesSolomon IslandsSouth AfricaSouth AsiaSouth Asia (IDA & IBRD)South SudanSpainSri LankaSt. Kitts and NevisSt. LuciaSt. Vincent and the GrenadinesSub-Saharan Africa Sub-Saharan Africa (excluding high income)Sub-Saharan Africa (IDA & IBRD countries)SudanSurinameSwazilandSwedenSwitzerlandSyrian Arab RepublicTajikistanTanzaniaThailandTimor-LesteTogoTongaTrinidad and TobagoTunisiaTurkeyUgandaUkraineUnited KingdomUnited StatesUpper middle incomeUruguayVanuatuVenezuela, RBVietnamWorldYemen, Rep.ZambiaZimbabwe Timeline:
This timeline shows a graph from 1965 to 2016 of Mauritius. No data until 1964. Number of actual observations by date: 52.
Source name:
World Development Indicators
Source organization:
International Monetary Fund, International Financial Statistics and data files.
Categories, topics:
Economy & Growth, Financial Sector
Last updated:
apr 23, 2017
Indicators value changes by year
At the date of observation
Value
Absolute change
Change from previous value
jan 1, 1965
1.896
+1.896
0.0%
jan 1, 1966
1.786
-0.11
-5.8%
jan 1, 1967
2.505
+0.719
40.29%
jan 1, 1968
1.879
-0.626
-25.01%
jan 1, 1969
6.977
+5.099
271.41%
jan 1, 1970
2.315
-4.662
-66.82%
jan 1, 1971
1.542
-0.773
-33.4%
jan 1, 1972
0.316
-1.226
-79.48%
jan 1, 1973
5.396
+5.08
1.61K%
jan 1, 1974
13.451
+8.055
149.28%
jan 1, 1975
29.116
+15.665
116.46%
jan 1, 1976
14.738
-14.377
-49.38%
jan 1, 1977
12.956
-1.783
-12.09%
jan 1, 1978
9.172
-3.783
-29.2%
jan 1, 1979
8.545
-0.627
-6.84%
jan 1, 1980
14.466
+5.921
69.29%
jan 1, 1981
42.0
+27.533
190.33%
jan 1, 1982
14.462
-27.538
-65.57%
jan 1, 1983
11.416
-3.046
-21.06%
jan 1, 1984
5.589
-5.826
-51.04%
jan 1, 1985
7.389
+1.8
32.2%
jan 1, 1986
6.699
-0.69
-9.34%
jan 1, 1987
1.633
-5.066
-75.63%
jan 1, 1988
0.519
-1.114
-68.23%
jan 1, 1989
9.159
+8.641
1.67K%
jan 1, 1990
12.67
+3.511
38.33%
jan 1, 1991
13.488
+0.818
6.46%
jan 1, 1992
7.001
-6.487
-48.09%
jan 1, 1993
4.644
-2.357
-33.67%
jan 1, 1994
10.518
+5.874
126.51%
jan 1, 1995
7.323
-3.194
-30.37%
jan 1, 1996
6.029
-1.294
-17.67%
jan 1, 1997
6.551
+0.522
8.65%
jan 1, 1998
6.833
+0.282
4.31%
jan 1, 1999
6.811
-0.023
-0.33%
jan 1, 2000
6.909
+0.098
1.44%
jan 1, 2001
4.199
-2.71
-39.22%
jan 1, 2002
5.389
+1.19
28.34%
jan 1, 2003
6.461
+1.071
19.88%
jan 1, 2004
3.924
-2.536
-39.26%
jan 1, 2005
4.71
+0.786
20.03%
jan 1, 2006
4.942
+0.231
4.91%
jan 1, 2007
8.933
+3.991
80.76%
jan 1, 2008
8.803
-0.13
-1.45%
jan 1, 2009
9.733
+0.93
10.56%
jan 1, 2010
2.55
-7.183
-73.8%
jan 1, 2011
2.893
+0.343
13.46%
jan 1, 2012
6.531
+3.638
125.77%
jan 1, 2013
3.852
-2.679
-41.02%
jan 1, 2014
3.543
-0.309
-8.02%
jan 1, 2015
3.218
-0.326
-9.19%
jan 1, 2016
1.287
-1.931
-60.02%
Ranking of countries by current statistics by years


Comments: