29
/
en
AIzaSyAYiBZKx7MnpbEhh9jyipgxe19OcubqV5w
April 1, 2024
92707
Brunei Darussalam
BRN
true
2
1
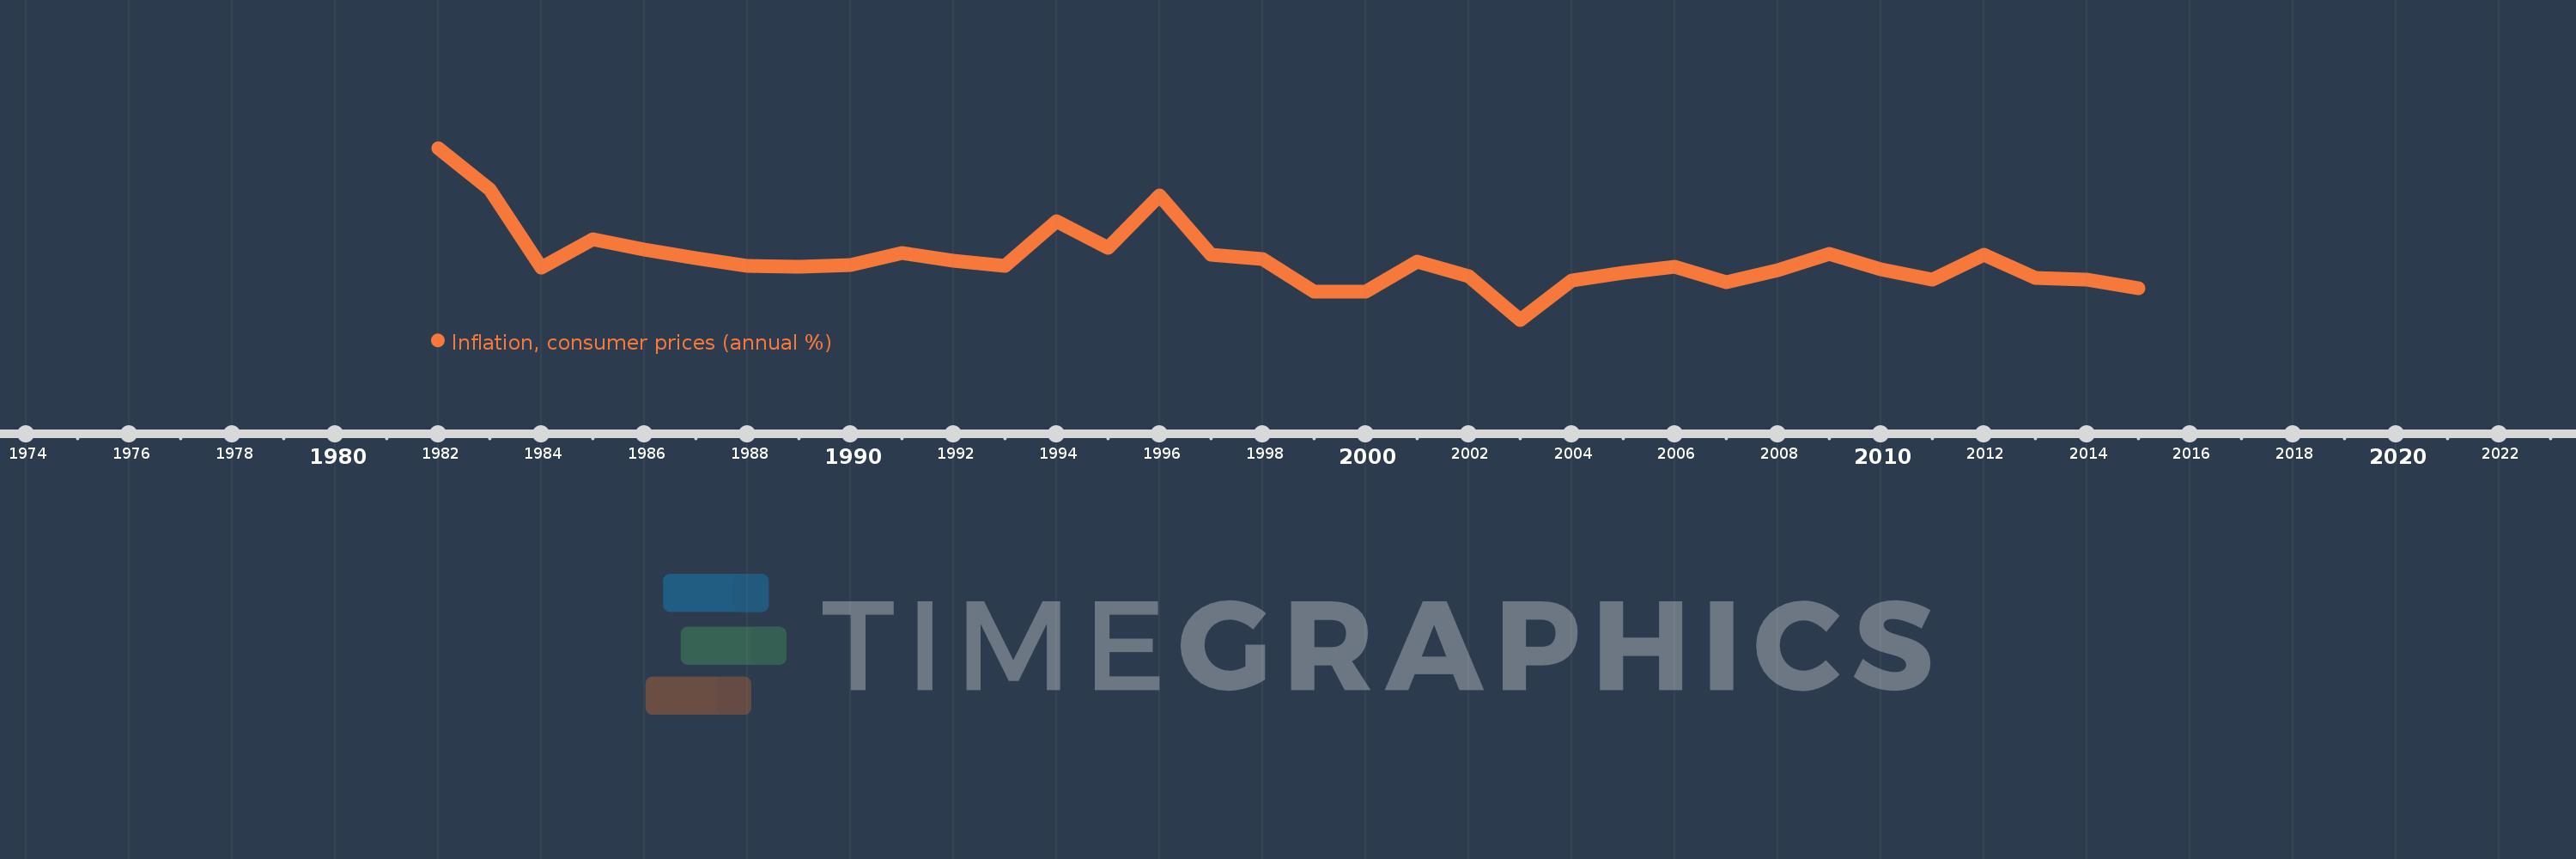
Inflation, consumer prices (annual %)
2015,2014,2013,2012,2011,2010,2009,2008,2007,2006,2005,2004,2003,2002,2001,2000,1999,1998,1997,1996,1995,1994,1993,1992,1991,1990,1989,1988,1987,1986,1985,1984,1983,1982
This statistics in other country:
AfghanistanAlbaniaAlgeriaAngolaAntigua and BarbudaArab WorldArgentinaArmeniaArubaAustraliaAustriaAzerbaijanBahamas, TheBahrainBangladeshBarbadosBelarusBelgiumBelizeBeninBhutanBoliviaBotswanaBrazilBrunei DarussalamBulgariaBurkina FasoBurundiCabo VerdeCambodiaCameroonCanadaCaribbean small statesCentral African RepublicCentral Europe and the BalticsChadChileChinaColombiaComorosCongo, Dem. Rep.Congo, Rep.Costa RicaCote d'IvoireCroatiaCyprusCzech RepublicDenmarkDjiboutiDominicaDominican RepublicEarly-demographic dividendEast Asia & PacificEast Asia & Pacific (excluding high income)East Asia & Pacific (IDA & IBRD countries)EcuadorEgypt, Arab Rep.El SalvadorEquatorial GuineaEstoniaEthiopiaEuro areaEurope & Central AsiaEurope & Central Asia (excluding high income)Europe & Central Asia (IDA & IBRD countries)European UnionFijiFinlandFragile and conflict affected situationsFranceGabonGambia, TheGeorgiaGermanyGhanaGreeceGrenadaGuatemalaGuineaGuinea-BissauGuyanaHaitiHeavily indebted poor countries (HIPC)High incomeHondurasHong Kong SAR, ChinaHungaryIBRD onlyIcelandIDA & IBRD totalIDA blendIDA onlyIDA totalIndiaIndonesiaIran, Islamic Rep.IraqIrelandIsraelItalyJamaicaJapanJordanKazakhstanKenyaKorea, Rep.KuwaitKyrgyz RepublicLao PDRLate-demographic dividendLatin America & Caribbean Latin America & Caribbean (excluding high income)Latin America & the Caribbean (IDA & IBRD countries)LatviaLeast developed countries: UN classificationLebanonLesothoLiberiaLibyaLithuaniaLow & middle incomeLow incomeLower middle incomeLuxembourgMacao SAR, ChinaMacedonia, FYRMadagascarMalawiMalaysiaMaldivesMaliMaltaMauritaniaMauritiusMexicoMiddle East & North AfricaMiddle East & North Africa (excluding high income)Middle East & North Africa (IDA & IBRD countries)Middle incomeMoldovaMongoliaMontenegroMoroccoMozambiqueMyanmarNamibiaNepalNetherlandsNew ZealandNicaraguaNigerNigeriaNorth AmericaNorwayOECD membersOmanOther small statesPakistanPanamaPapua New GuineaParaguayPeruPhilippinesPolandPortugalPost-demographic dividendPre-demographic dividendQatarRomaniaRussian FederationRwandaSamoaSao Tome and PrincipeSaudi ArabiaSenegalSerbiaSeychellesSierra LeoneSingaporeSlovak RepublicSloveniaSmall statesSolomon IslandsSouth AfricaSouth AsiaSouth Asia (IDA & IBRD)South SudanSpainSri LankaSt. Kitts and NevisSt. LuciaSt. Vincent and the GrenadinesSub-Saharan Africa Sub-Saharan Africa (excluding high income)Sub-Saharan Africa (IDA & IBRD countries)SudanSurinameSwazilandSwedenSwitzerlandSyrian Arab RepublicTajikistanTanzaniaThailandTimor-LesteTogoTongaTrinidad and TobagoTunisiaTurkeyUgandaUkraineUnited KingdomUnited StatesUpper middle incomeUruguayVanuatuVenezuela, RBVietnamWorldYemen, Rep.ZambiaZimbabwe Timeline:
This timeline shows a graph from 1982 to 2015 of Brunei Darussalam. No data until 1981. Number of actual observations by date: 34.
Source name:
World Development Indicators
Source organization:
International Monetary Fund, International Financial Statistics and data files.
Categories, topics:
Economy & Growth, Financial Sector
Last updated:
apr 23, 2017
Indicators value changes by year
Minimum:
-2.315
jan 1, 2003
At the date of observation
Value
Absolute change
Change from previous value
jan 1, 1982
9.137
+9.137
0.0%
jan 1, 1983
6.357
-2.78
-30.43%
jan 1, 1984
1.166
-5.19
-81.65%
jan 1, 1985
3.074
+1.908
163.59%
jan 1, 1986
2.353
-0.721
-23.45%
jan 1, 1987
1.781
-0.572
-24.31%
jan 1, 1988
1.247
-0.534
-30.0%
jan 1, 1989
1.193
-0.054
-4.33%
jan 1, 1990
1.304
+0.111
9.34%
jan 1, 1991
2.139
+0.834
63.97%
jan 1, 1992
1.6
-0.539
-25.19%
jan 1, 1993
1.28
-0.32
-20.03%
jan 1, 1994
4.252
+2.972
232.29%
jan 1, 1995
2.463
-1.789
-42.08%
jan 1, 1996
5.967
+3.504
142.3%
jan 1, 1997
1.996
-3.971
-66.55%
jan 1, 1998
1.712
-0.285
-14.26%
jan 1, 1999
-0.441
-2.153
-125.79%
jan 1, 2000
-0.416
+0.026
-5.83%
jan 1, 2001
1.558
+1.974
-474.89%
jan 1, 2002
0.596
-0.962
-61.76%
jan 1, 2003
-2.315
-2.911
-488.49%
jan 1, 2004
0.3
+2.615
-112.96%
jan 1, 2005
0.814
+0.514
171.41%
jan 1, 2006
1.244
+0.43
52.84%
jan 1, 2007
0.16
-1.085
-87.15%
jan 1, 2008
0.968
+0.808
505.28%
jan 1, 2009
2.085
+1.117
115.44%
jan 1, 2010
1.036
-1.049
-50.32%
jan 1, 2011
0.357
-0.679
-65.54%
jan 1, 2012
2.016
+1.659
464.89%
jan 1, 2013
0.464
-1.552
-76.98%
jan 1, 2014
0.383
-0.081
-17.42%
jan 1, 2015
-0.194
-0.578
-150.73%
Ranking of countries by current statistics by years


Comments: