29
/
en
AIzaSyAYiBZKx7MnpbEhh9jyipgxe19OcubqV5w
April 1, 2024
264754
Togo
TGO
true
2
1
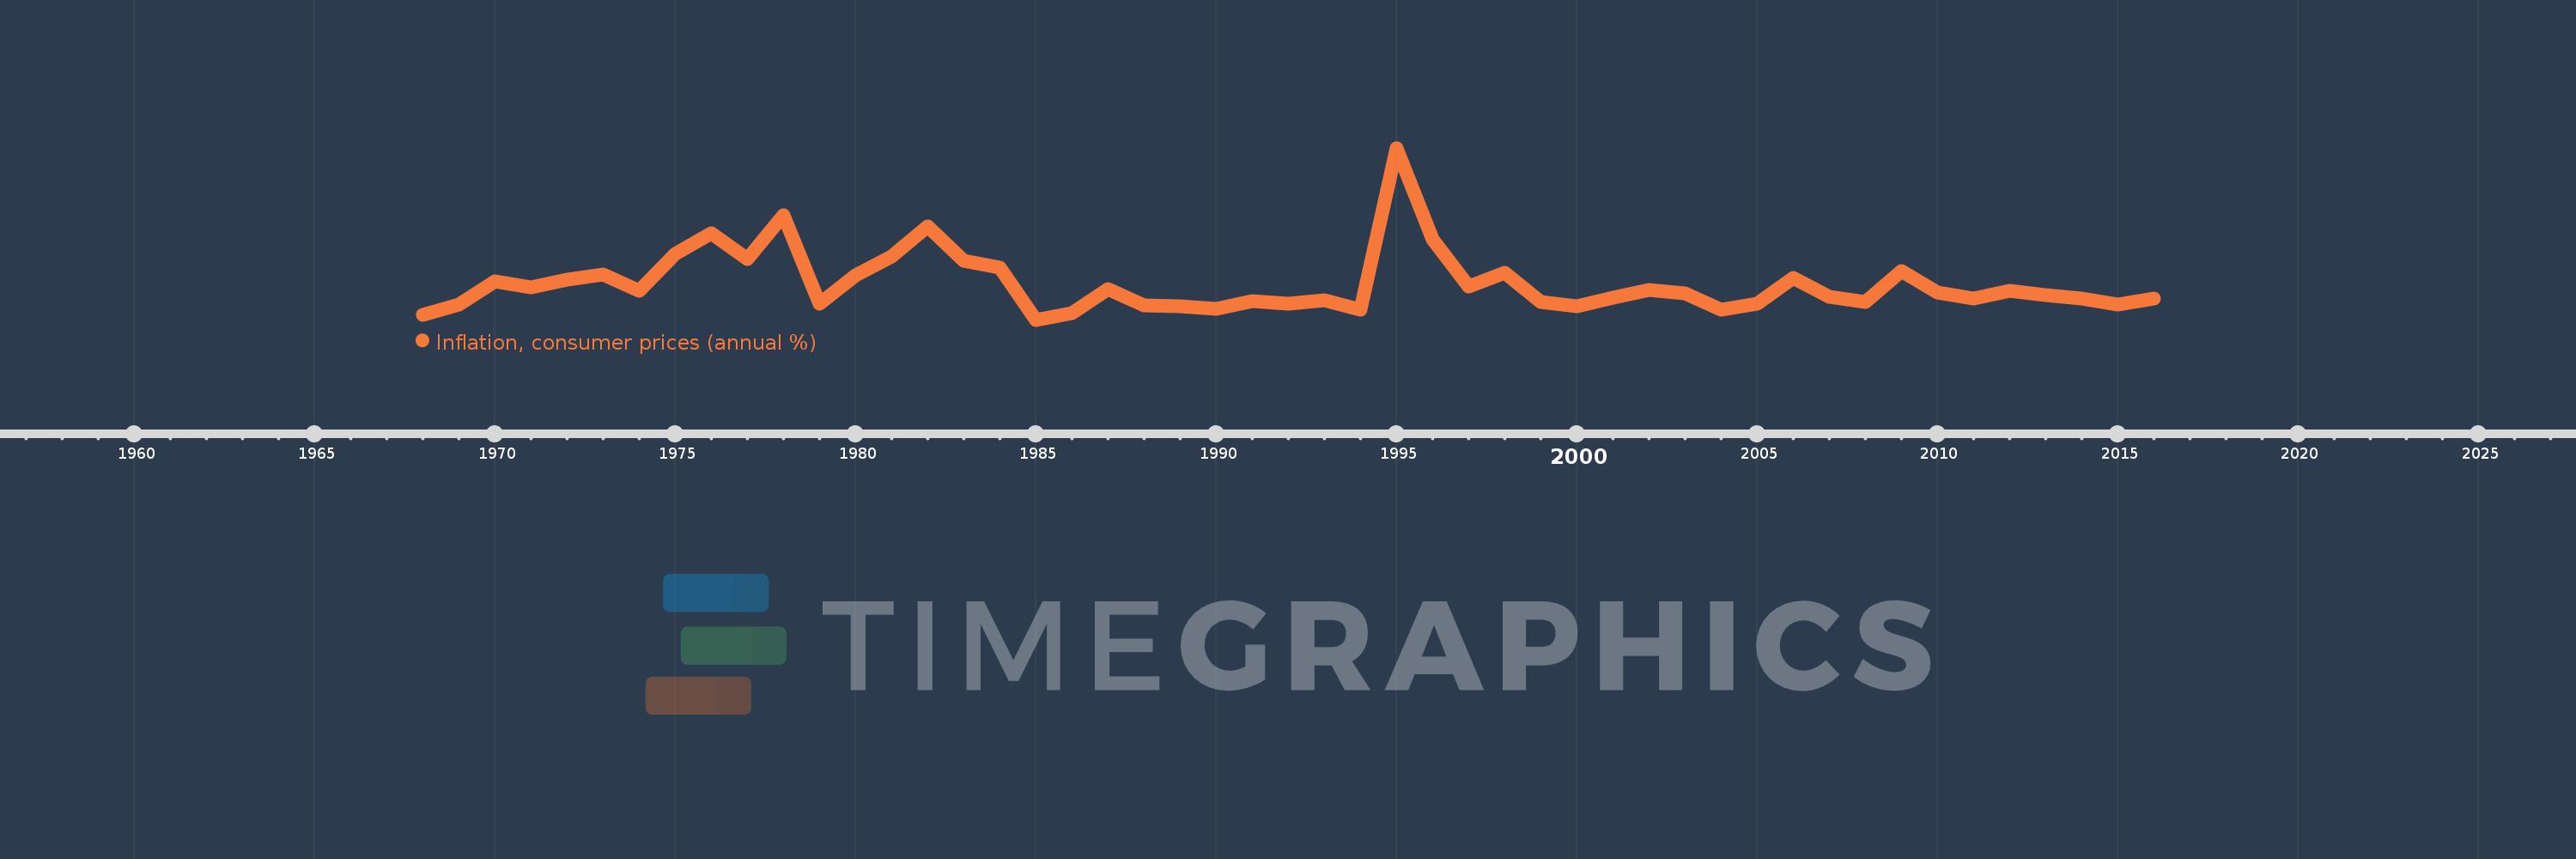
Inflation, consumer prices (annual %)
2016,2015,2014,2013,2012,2011,2010,2009,2008,2007,2006,2005,2004,2003,2002,2001,2000,1999,1998,1997,1996,1995,1994,1993,1992,1991,1990,1989,1988,1987,1986,1985,1984,1983,1982,1981,1980,1979,1978,1977,1976,1975,1974,1973,1972,1971,1970,1969,1968
This statistics in other country:
AfghanistanAlbaniaAlgeriaAngolaAntigua and BarbudaArab WorldArgentinaArmeniaArubaAustraliaAustriaAzerbaijanBahamas, TheBahrainBangladeshBarbadosBelarusBelgiumBelizeBeninBhutanBoliviaBotswanaBrazilBrunei DarussalamBulgariaBurkina FasoBurundiCabo VerdeCambodiaCameroonCanadaCaribbean small statesCentral African RepublicCentral Europe and the BalticsChadChileChinaColombiaComorosCongo, Dem. Rep.Congo, Rep.Costa RicaCote d'IvoireCroatiaCyprusCzech RepublicDenmarkDjiboutiDominicaDominican RepublicEarly-demographic dividendEast Asia & PacificEast Asia & Pacific (excluding high income)East Asia & Pacific (IDA & IBRD countries)EcuadorEgypt, Arab Rep.El SalvadorEquatorial GuineaEstoniaEthiopiaEuro areaEurope & Central AsiaEurope & Central Asia (excluding high income)Europe & Central Asia (IDA & IBRD countries)European UnionFijiFinlandFragile and conflict affected situationsFranceGabonGambia, TheGeorgiaGermanyGhanaGreeceGrenadaGuatemalaGuineaGuinea-BissauGuyanaHaitiHeavily indebted poor countries (HIPC)High incomeHondurasHong Kong SAR, ChinaHungaryIBRD onlyIcelandIDA & IBRD totalIDA blendIDA onlyIDA totalIndiaIndonesiaIran, Islamic Rep.IraqIrelandIsraelItalyJamaicaJapanJordanKazakhstanKenyaKorea, Rep.KuwaitKyrgyz RepublicLao PDRLate-demographic dividendLatin America & Caribbean Latin America & Caribbean (excluding high income)Latin America & the Caribbean (IDA & IBRD countries)LatviaLeast developed countries: UN classificationLebanonLesothoLiberiaLibyaLithuaniaLow & middle incomeLow incomeLower middle incomeLuxembourgMacao SAR, ChinaMacedonia, FYRMadagascarMalawiMalaysiaMaldivesMaliMaltaMauritaniaMauritiusMexicoMiddle East & North AfricaMiddle East & North Africa (excluding high income)Middle East & North Africa (IDA & IBRD countries)Middle incomeMoldovaMongoliaMontenegroMoroccoMozambiqueMyanmarNamibiaNepalNetherlandsNew ZealandNicaraguaNigerNigeriaNorth AmericaNorwayOECD membersOmanOther small statesPakistanPanamaPapua New GuineaParaguayPeruPhilippinesPolandPortugalPost-demographic dividendPre-demographic dividendQatarRomaniaRussian FederationRwandaSamoaSao Tome and PrincipeSaudi ArabiaSenegalSerbiaSeychellesSierra LeoneSingaporeSlovak RepublicSloveniaSmall statesSolomon IslandsSouth AfricaSouth AsiaSouth Asia (IDA & IBRD)South SudanSpainSri LankaSt. Kitts and NevisSt. LuciaSt. Vincent and the GrenadinesSub-Saharan Africa Sub-Saharan Africa (excluding high income)Sub-Saharan Africa (IDA & IBRD countries)SudanSurinameSwazilandSwedenSwitzerlandSyrian Arab RepublicTajikistanTanzaniaThailandTimor-LesteTogoTongaTrinidad and TobagoTunisiaTurkeyUgandaUkraineUnited KingdomUnited StatesUpper middle incomeUruguayVanuatuVenezuela, RBVietnamWorldYemen, Rep.ZambiaZimbabwe Timeline:
This timeline shows a graph from 1968 to 2016 of Togo. No data until 1967. Number of actual observations by date: 49.
Source name:
World Development Indicators
Source organization:
International Monetary Fund, International Financial Statistics and data files.
Categories, topics:
Economy & Growth, Financial Sector
Last updated:
apr 23, 2017
Indicators value changes by year
Minimum:
-3.527
jan 1, 1985
Maximum:
39.163
jan 1, 1995
At the date of observation
Value
Absolute change
Change from previous value
jan 1, 1968
-2.319
-2.319
0.0%
jan 1, 1969
0.297
+2.616
-112.8%
jan 1, 1970
6.016
+5.719
1.93K%
jan 1, 1971
4.481
-1.535
-25.52%
jan 1, 1972
6.492
+2.011
44.89%
jan 1, 1973
7.727
+1.235
19.02%
jan 1, 1974
3.615
-4.111
-53.21%
jan 1, 1975
12.832
+9.217
254.93%
jan 1, 1976
18.012
+5.18
40.37%
jan 1, 1977
11.641
-6.371
-35.37%
jan 1, 1978
22.457
+10.816
92.92%
jan 1, 1979
0.443
-22.014
-98.03%
jan 1, 1980
7.539
+7.096
1.6K%
jan 1, 1981
12.307
+4.768
63.24%
jan 1, 1982
19.717
+7.41
60.21%
jan 1, 1983
11.13
-8.587
-43.55%
jan 1, 1984
9.355
-1.774
-15.94%
jan 1, 1985
-3.527
-12.882
-137.7%
jan 1, 1986
-1.814
+1.712
-48.55%
jan 1, 1987
4.125
+5.939
-327.32%
jan 1, 1988
0.054
-4.071
-98.69%
jan 1, 1989
-0.151
-0.205
-379.42%
jan 1, 1990
-0.839
-0.688
456.22%
jan 1, 1991
1.015
+1.855
-220.96%
jan 1, 1992
0.387
-0.628
-61.88%
jan 1, 1993
1.394
+1.007
260.08%
jan 1, 1994
-1.007
-2.401
-172.24%
jan 1, 1995
39.163
+40.17
-3.99K%
jan 1, 1996
16.434
-22.729
-58.04%
jan 1, 1997
4.688
-11.746
-71.48%
jan 1, 1998
8.251
+3.563
76.02%
jan 1, 1999
0.973
-7.277
-88.2%
jan 1, 2000
-0.071
-1.044
-107.25%
jan 1, 2001
1.89
+1.961
-2.78K%
jan 1, 2002
3.91
+2.02
106.88%
jan 1, 2003
3.074
-0.836
-21.38%
jan 1, 2004
-0.963
-4.037
-131.33%
jan 1, 2005
0.392
+1.355
-140.69%
jan 1, 2006
6.802
+6.41
1.64K%
jan 1, 2007
2.227
-4.575
-67.26%
jan 1, 2008
0.96
-1.267
-56.89%
jan 1, 2009
8.682
+7.722
804.42%
jan 1, 2010
3.313
-5.369
-61.84%
jan 1, 2011
1.834
-1.479
-44.64%
jan 1, 2012
3.572
+1.738
94.76%
jan 1, 2013
2.631
-0.942
-26.36%
jan 1, 2014
1.767
-0.864
-32.84%
jan 1, 2015
0.187
-1.58
-89.43%
jan 1, 2016
1.79
+1.603
858.6%
Ranking of countries by current statistics by years


Comments: