29
/
en
AIzaSyAYiBZKx7MnpbEhh9jyipgxe19OcubqV5w
April 1, 2024
117032
Cyprus
CYP
true
2
1
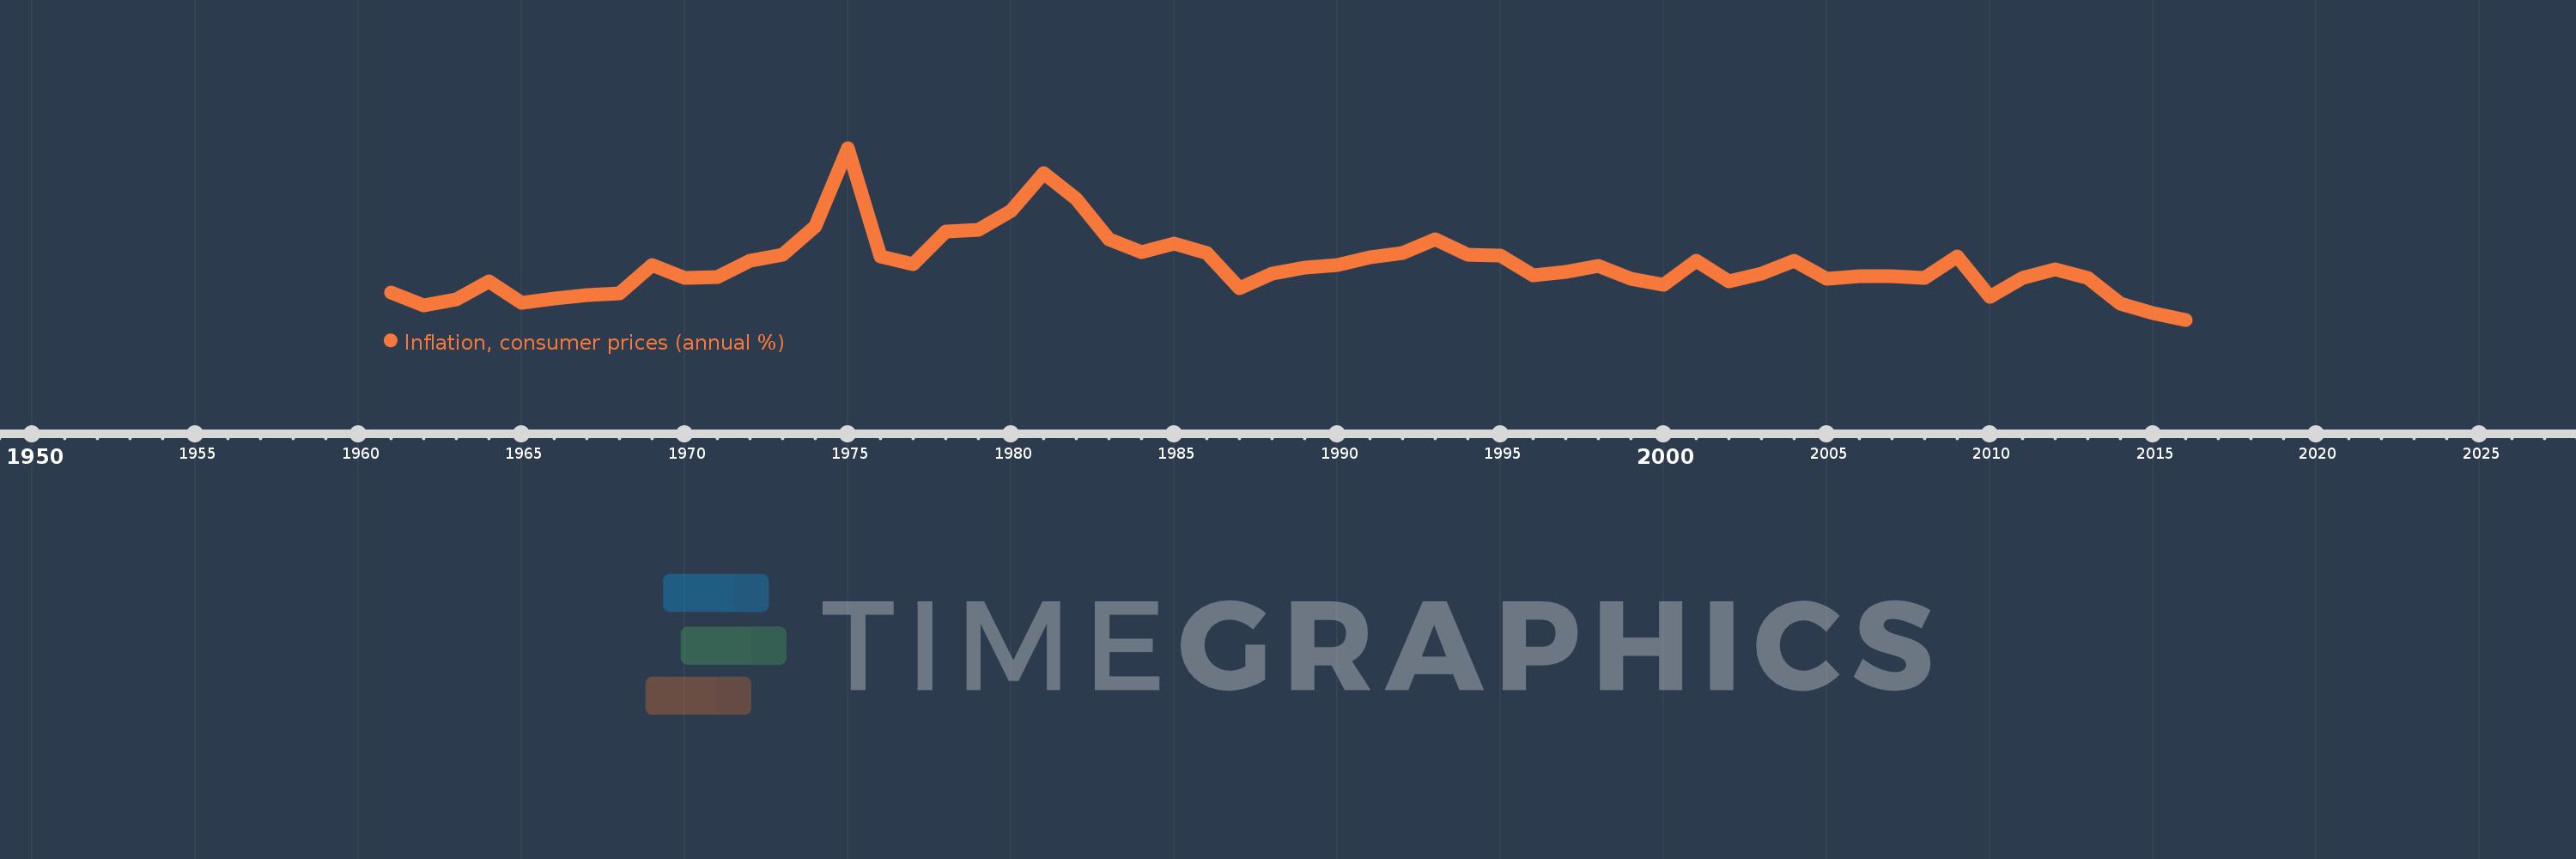
Inflation, consumer prices (annual %)
2016,2015,2014,2013,2012,2011,2010,2009,2008,2007,2006,2005,2004,2003,2002,2001,2000,1999,1998,1997,1996,1995,1994,1993,1992,1991,1990,1989,1988,1987,1986,1985,1984,1983,1982,1981,1980,1979,1978,1977,1976,1975,1974,1973,1972,1971,1970,1969,1968,1967,1966,1965,1964,1963,1962,1961
This statistics in other country:
AfghanistanAlbaniaAlgeriaAngolaAntigua and BarbudaArab WorldArgentinaArmeniaArubaAustraliaAustriaAzerbaijanBahamas, TheBahrainBangladeshBarbadosBelarusBelgiumBelizeBeninBhutanBoliviaBotswanaBrazilBrunei DarussalamBulgariaBurkina FasoBurundiCabo VerdeCambodiaCameroonCanadaCaribbean small statesCentral African RepublicCentral Europe and the BalticsChadChileChinaColombiaComorosCongo, Dem. Rep.Congo, Rep.Costa RicaCote d'IvoireCroatiaCyprusCzech RepublicDenmarkDjiboutiDominicaDominican RepublicEarly-demographic dividendEast Asia & PacificEast Asia & Pacific (excluding high income)East Asia & Pacific (IDA & IBRD countries)EcuadorEgypt, Arab Rep.El SalvadorEquatorial GuineaEstoniaEthiopiaEuro areaEurope & Central AsiaEurope & Central Asia (excluding high income)Europe & Central Asia (IDA & IBRD countries)European UnionFijiFinlandFragile and conflict affected situationsFranceGabonGambia, TheGeorgiaGermanyGhanaGreeceGrenadaGuatemalaGuineaGuinea-BissauGuyanaHaitiHeavily indebted poor countries (HIPC)High incomeHondurasHong Kong SAR, ChinaHungaryIBRD onlyIcelandIDA & IBRD totalIDA blendIDA onlyIDA totalIndiaIndonesiaIran, Islamic Rep.IraqIrelandIsraelItalyJamaicaJapanJordanKazakhstanKenyaKorea, Rep.KuwaitKyrgyz RepublicLao PDRLate-demographic dividendLatin America & Caribbean Latin America & Caribbean (excluding high income)Latin America & the Caribbean (IDA & IBRD countries)LatviaLeast developed countries: UN classificationLebanonLesothoLiberiaLibyaLithuaniaLow & middle incomeLow incomeLower middle incomeLuxembourgMacao SAR, ChinaMacedonia, FYRMadagascarMalawiMalaysiaMaldivesMaliMaltaMauritaniaMauritiusMexicoMiddle East & North AfricaMiddle East & North Africa (excluding high income)Middle East & North Africa (IDA & IBRD countries)Middle incomeMoldovaMongoliaMontenegroMoroccoMozambiqueMyanmarNamibiaNepalNetherlandsNew ZealandNicaraguaNigerNigeriaNorth AmericaNorwayOECD membersOmanOther small statesPakistanPanamaPapua New GuineaParaguayPeruPhilippinesPolandPortugalPost-demographic dividendPre-demographic dividendQatarRomaniaRussian FederationRwandaSamoaSao Tome and PrincipeSaudi ArabiaSenegalSerbiaSeychellesSierra LeoneSingaporeSlovak RepublicSloveniaSmall statesSolomon IslandsSouth AfricaSouth AsiaSouth Asia (IDA & IBRD)South SudanSpainSri LankaSt. Kitts and NevisSt. LuciaSt. Vincent and the GrenadinesSub-Saharan Africa Sub-Saharan Africa (excluding high income)Sub-Saharan Africa (IDA & IBRD countries)SudanSurinameSwazilandSwedenSwitzerlandSyrian Arab RepublicTajikistanTanzaniaThailandTimor-LesteTogoTongaTrinidad and TobagoTunisiaTurkeyUgandaUkraineUnited KingdomUnited StatesUpper middle incomeUruguayVanuatuVenezuela, RBVietnamWorldYemen, Rep.ZambiaZimbabwe Timeline:
This timeline shows a graph from 1961 to 2016 of Cyprus. No data until 1960. Number of actual observations by date: 56.
Source name:
World Development Indicators
Source organization:
International Monetary Fund, International Financial Statistics and data files.
Categories, topics:
Economy & Growth, Financial Sector
Last updated:
apr 23, 2017
Indicators value changes by year
Minimum:
-2.097
jan 1, 2016
Maximum:
16.177
jan 1, 1975
At the date of observation
Value
Absolute change
Change from previous value
jan 1, 1961
0.827
+0.827
0.0%
jan 1, 1962
-0.615
-1.443
-174.38%
jan 1, 1963
0.103
+0.719
-116.77%
jan 1, 1964
1.959
+1.856
1.8K%
jan 1, 1965
-0.303
-2.262
-115.49%
jan 1, 1966
0.203
+0.506
-166.87%
jan 1, 1967
0.506
+0.303
149.49%
jan 1, 1968
0.705
+0.199
39.3%
jan 1, 1969
3.767
+3.062
434.33%
jan 1, 1970
2.385
-1.382
-36.68%
jan 1, 1971
2.4
+0.015
0.63%
jan 1, 1972
4.144
+1.744
72.65%
jan 1, 1973
4.832
+0.688
16.61%
jan 1, 1974
7.809
+2.977
61.6%
jan 1, 1975
16.177
+8.368
107.16%
jan 1, 1976
4.639
-11.537
-71.32%
jan 1, 1977
3.854
-0.785
-16.92%
jan 1, 1978
7.326
+3.472
90.08%
jan 1, 1979
7.436
+0.11
1.5%
jan 1, 1980
9.464
+2.027
27.26%
jan 1, 1981
13.518
+4.054
42.84%
jan 1, 1982
10.745
-2.773
-20.51%
jan 1, 1983
6.433
-4.312
-40.13%
jan 1, 1984
5.05
-1.383
-21.5%
jan 1, 1985
5.992
+0.942
18.66%
jan 1, 1986
5.034
-0.957
-15.98%
jan 1, 1987
1.218
-3.816
-75.8%
jan 1, 1988
2.792
+1.573
129.13%
jan 1, 1989
3.429
+0.638
22.84%
jan 1, 1990
3.765
+0.336
9.8%
jan 1, 1991
4.502
+0.737
19.56%
jan 1, 1992
5.035
+0.533
11.84%
jan 1, 1993
6.51
+1.475
29.29%
jan 1, 1994
4.854
-1.656
-25.44%
jan 1, 1995
4.699
-0.156
-3.21%
jan 1, 1996
2.616
-2.083
-44.33%
jan 1, 1997
2.979
+0.363
13.88%
jan 1, 1998
3.605
+0.626
21.03%
jan 1, 1999
2.228
-1.378
-38.21%
jan 1, 2000
1.63
-0.598
-26.83%
jan 1, 2001
4.142
+2.512
154.09%
jan 1, 2002
1.977
-2.165
-52.26%
jan 1, 2003
2.801
+0.824
41.68%
jan 1, 2004
4.139
+1.338
47.76%
jan 1, 2005
2.286
-1.853
-44.76%
jan 1, 2006
2.558
+0.272
11.91%
jan 1, 2007
2.496
-0.063
-2.45%
jan 1, 2008
2.372
-0.123
-4.94%
jan 1, 2009
4.669
+2.297
96.8%
jan 1, 2010
0.374
-4.295
-91.99%
jan 1, 2011
2.381
+2.007
536.56%
jan 1, 2012
3.289
+0.908
38.14%
jan 1, 2013
2.39
-0.9
-27.35%
jan 1, 2014
-0.4
-2.79
-116.74%
jan 1, 2015
-1.355
-0.955
238.7%
jan 1, 2016
-2.097
-0.742
54.76%
Ranking of countries by current statistics by years


Comments: