29
/
en
AIzaSyAYiBZKx7MnpbEhh9jyipgxe19OcubqV5w
April 1, 2024
276790
United States
USA
true
2
1
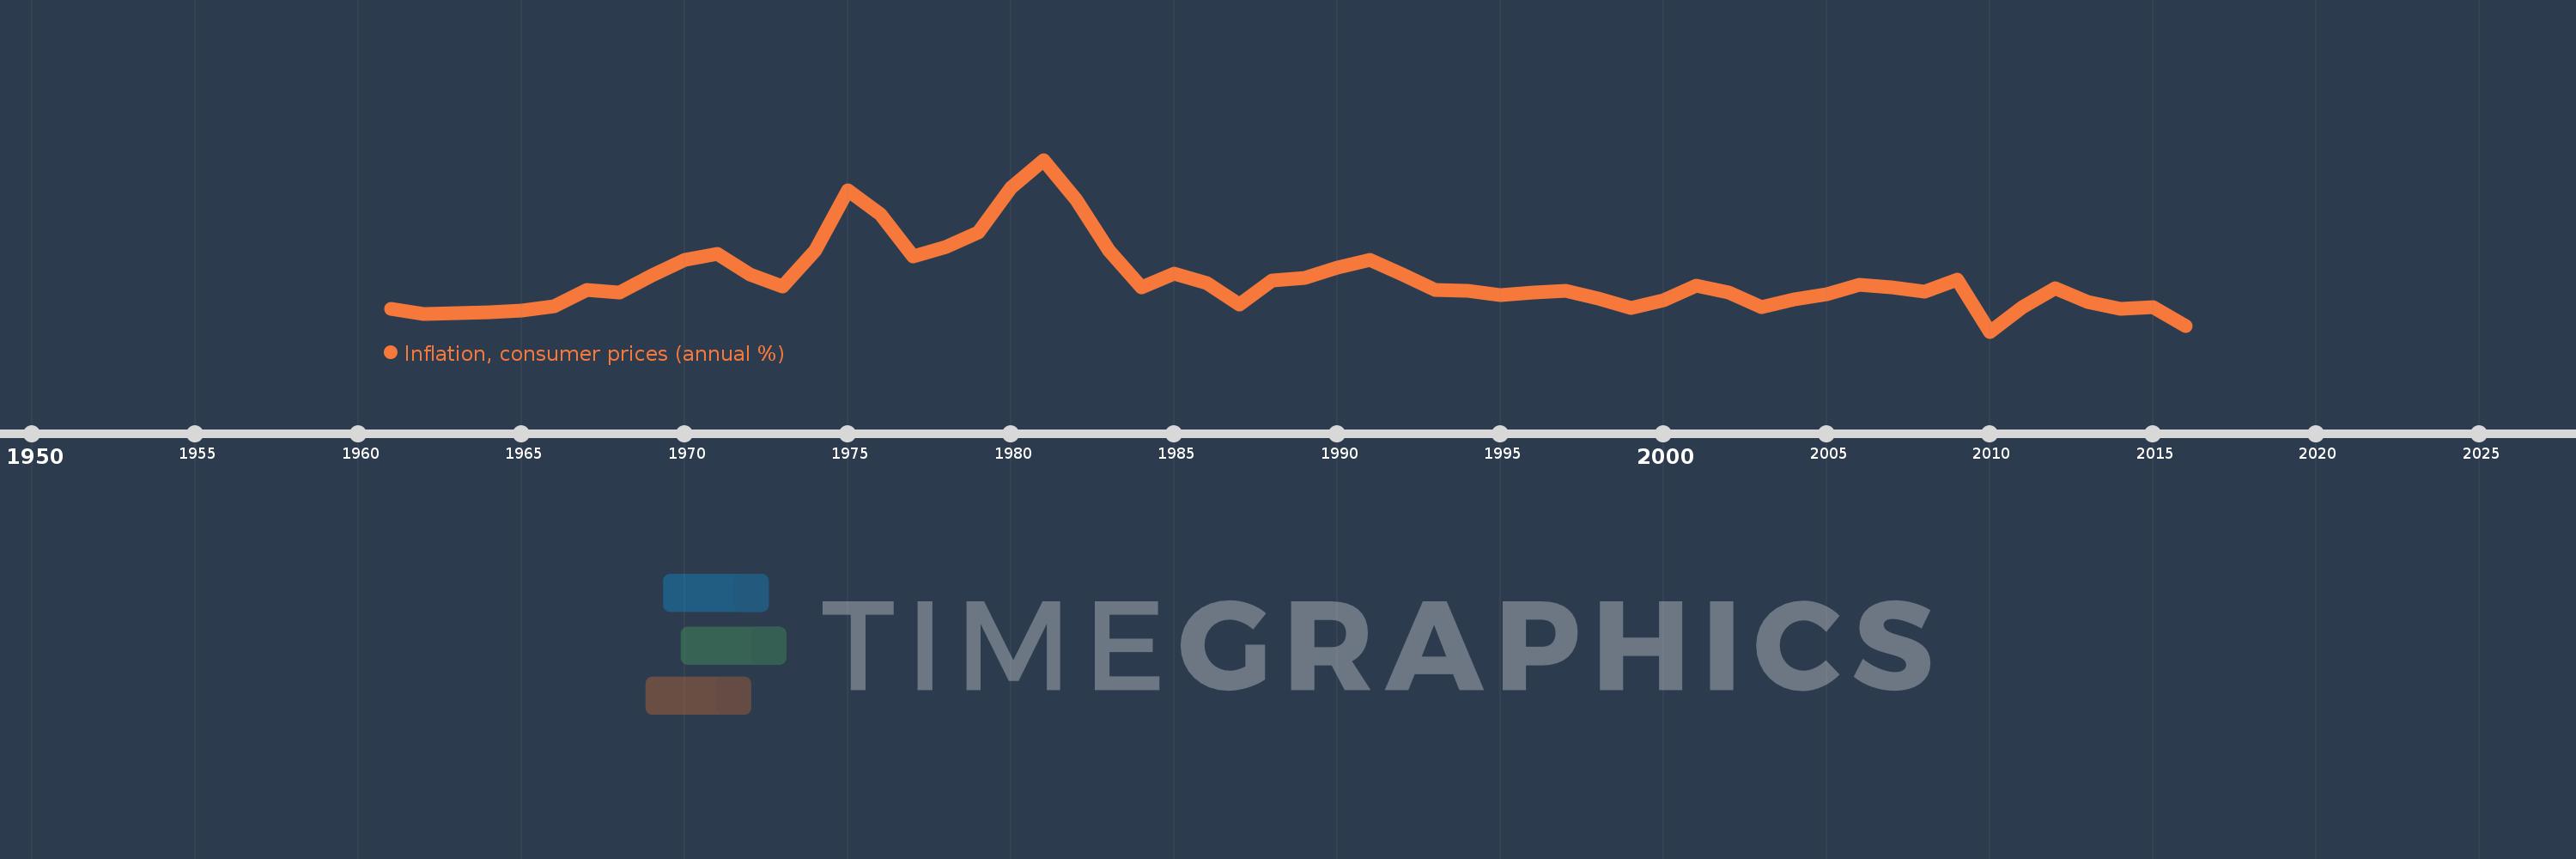
Inflation, consumer prices (annual %)
2016,2015,2014,2013,2012,2011,2010,2009,2008,2007,2006,2005,2004,2003,2002,2001,2000,1999,1998,1997,1996,1995,1994,1993,1992,1991,1990,1989,1988,1987,1986,1985,1984,1983,1982,1981,1980,1979,1978,1977,1976,1975,1974,1973,1972,1971,1970,1969,1968,1967,1966,1965,1964,1963,1962,1961
This statistics in other country:
AfghanistanAlbaniaAlgeriaAngolaAntigua and BarbudaArab WorldArgentinaArmeniaArubaAustraliaAustriaAzerbaijanBahamas, TheBahrainBangladeshBarbadosBelarusBelgiumBelizeBeninBhutanBoliviaBotswanaBrazilBrunei DarussalamBulgariaBurkina FasoBurundiCabo VerdeCambodiaCameroonCanadaCaribbean small statesCentral African RepublicCentral Europe and the BalticsChadChileChinaColombiaComorosCongo, Dem. Rep.Congo, Rep.Costa RicaCote d'IvoireCroatiaCyprusCzech RepublicDenmarkDjiboutiDominicaDominican RepublicEarly-demographic dividendEast Asia & PacificEast Asia & Pacific (excluding high income)East Asia & Pacific (IDA & IBRD countries)EcuadorEgypt, Arab Rep.El SalvadorEquatorial GuineaEstoniaEthiopiaEuro areaEurope & Central AsiaEurope & Central Asia (excluding high income)Europe & Central Asia (IDA & IBRD countries)European UnionFijiFinlandFragile and conflict affected situationsFranceGabonGambia, TheGeorgiaGermanyGhanaGreeceGrenadaGuatemalaGuineaGuinea-BissauGuyanaHaitiHeavily indebted poor countries (HIPC)High incomeHondurasHong Kong SAR, ChinaHungaryIBRD onlyIcelandIDA & IBRD totalIDA blendIDA onlyIDA totalIndiaIndonesiaIran, Islamic Rep.IraqIrelandIsraelItalyJamaicaJapanJordanKazakhstanKenyaKorea, Rep.KuwaitKyrgyz RepublicLao PDRLate-demographic dividendLatin America & Caribbean Latin America & Caribbean (excluding high income)Latin America & the Caribbean (IDA & IBRD countries)LatviaLeast developed countries: UN classificationLebanonLesothoLiberiaLibyaLithuaniaLow & middle incomeLow incomeLower middle incomeLuxembourgMacao SAR, ChinaMacedonia, FYRMadagascarMalawiMalaysiaMaldivesMaliMaltaMauritaniaMauritiusMexicoMiddle East & North AfricaMiddle East & North Africa (excluding high income)Middle East & North Africa (IDA & IBRD countries)Middle incomeMoldovaMongoliaMontenegroMoroccoMozambiqueMyanmarNamibiaNepalNetherlandsNew ZealandNicaraguaNigerNigeriaNorth AmericaNorwayOECD membersOmanOther small statesPakistanPanamaPapua New GuineaParaguayPeruPhilippinesPolandPortugalPost-demographic dividendPre-demographic dividendQatarRomaniaRussian FederationRwandaSamoaSao Tome and PrincipeSaudi ArabiaSenegalSerbiaSeychellesSierra LeoneSingaporeSlovak RepublicSloveniaSmall statesSolomon IslandsSouth AfricaSouth AsiaSouth Asia (IDA & IBRD)South SudanSpainSri LankaSt. Kitts and NevisSt. LuciaSt. Vincent and the GrenadinesSub-Saharan Africa Sub-Saharan Africa (excluding high income)Sub-Saharan Africa (IDA & IBRD countries)SudanSurinameSwazilandSwedenSwitzerlandSyrian Arab RepublicTajikistanTanzaniaThailandTimor-LesteTogoTongaTrinidad and TobagoTunisiaTurkeyUgandaUkraineUnited KingdomUnited StatesUpper middle incomeUruguayVanuatuVenezuela, RBVietnamWorldYemen, Rep.ZambiaZimbabwe Timeline:
This timeline shows a graph from 1961 to 2016 of United States. No data until 1960. Number of actual observations by date: 56.
Source name:
World Development Indicators
Source organization:
International Monetary Fund, International Financial Statistics and data files.
Categories, topics:
Economy & Growth, Financial Sector
Last updated:
apr 23, 2017
Indicators value changes by year
Minimum:
-0.356
jan 1, 2010
Maximum:
13.509
jan 1, 1981
At the date of observation
Value
Absolute change
Change from previous value
jan 1, 1961
1.51
+1.51
0.0%
jan 1, 1962
1.075
-0.435
-28.79%
jan 1, 1963
1.116
+0.041
3.8%
jan 1, 1964
1.214
+0.098
8.79%
jan 1, 1965
1.309
+0.094
7.78%
jan 1, 1966
1.668
+0.36
27.5%
jan 1, 1967
2.991
+1.323
79.27%
jan 1, 1968
2.776
-0.215
-7.2%
jan 1, 1969
4.218
+1.442
51.96%
jan 1, 1970
5.415
+1.197
28.38%
jan 1, 1971
5.895
+0.481
8.88%
jan 1, 1972
4.256
-1.639
-27.81%
jan 1, 1973
3.306
-0.95
-22.33%
jan 1, 1974
6.22
+2.914
88.17%
jan 1, 1975
11.035
+4.815
77.41%
jan 1, 1976
9.132
-1.903
-17.25%
jan 1, 1977
5.737
-3.395
-37.18%
jan 1, 1978
6.486
+0.749
13.06%
jan 1, 1979
7.647
+1.161
17.9%
jan 1, 1980
11.266
+3.619
47.32%
jan 1, 1981
13.509
+2.243
19.91%
jan 1, 1982
10.316
-3.194
-23.64%
jan 1, 1983
6.161
-4.155
-40.28%
jan 1, 1984
3.212
-2.948
-47.86%
jan 1, 1985
4.317
+1.105
34.39%
jan 1, 1986
3.561
-0.756
-17.51%
jan 1, 1987
1.859
-1.702
-47.8%
jan 1, 1988
3.741
+1.882
101.26%
jan 1, 1989
4.009
+0.268
7.17%
jan 1, 1990
4.827
+0.818
20.4%
jan 1, 1991
5.398
+0.571
11.83%
jan 1, 1992
4.235
-1.163
-21.55%
jan 1, 1993
3.029
-1.206
-28.48%
jan 1, 1994
2.952
-0.077
-2.55%
jan 1, 1995
2.607
-0.344
-11.66%
jan 1, 1996
2.805
+0.198
7.59%
jan 1, 1997
2.931
+0.126
4.48%
jan 1, 1998
2.338
-0.594
-20.25%
jan 1, 1999
1.552
-0.785
-33.6%
jan 1, 2000
2.188
+0.636
40.96%
jan 1, 2001
3.377
+1.189
54.33%
jan 1, 2002
2.826
-0.551
-16.31%
jan 1, 2003
1.586
-1.24
-43.88%
jan 1, 2004
2.27
+0.684
43.13%
jan 1, 2005
2.677
+0.407
17.94%
jan 1, 2006
3.393
+0.716
26.73%
jan 1, 2007
3.226
-0.167
-4.92%
jan 1, 2008
2.853
-0.373
-11.57%
jan 1, 2009
3.839
+0.986
34.58%
jan 1, 2010
-0.356
-4.195
-109.26%
jan 1, 2011
1.64
+1.996
-561.27%
jan 1, 2012
3.157
+1.517
92.49%
jan 1, 2013
2.069
-1.088
-34.45%
jan 1, 2014
1.465
-0.605
-29.21%
jan 1, 2015
1.622
+0.157
10.74%
jan 1, 2016
0.119
-1.504
-92.69%
Ranking of countries by current statistics by years


Comments: