29
/
en
AIzaSyAYiBZKx7MnpbEhh9jyipgxe19OcubqV5w
April 1, 2024
227539
Qatar
QAT
true
2
1
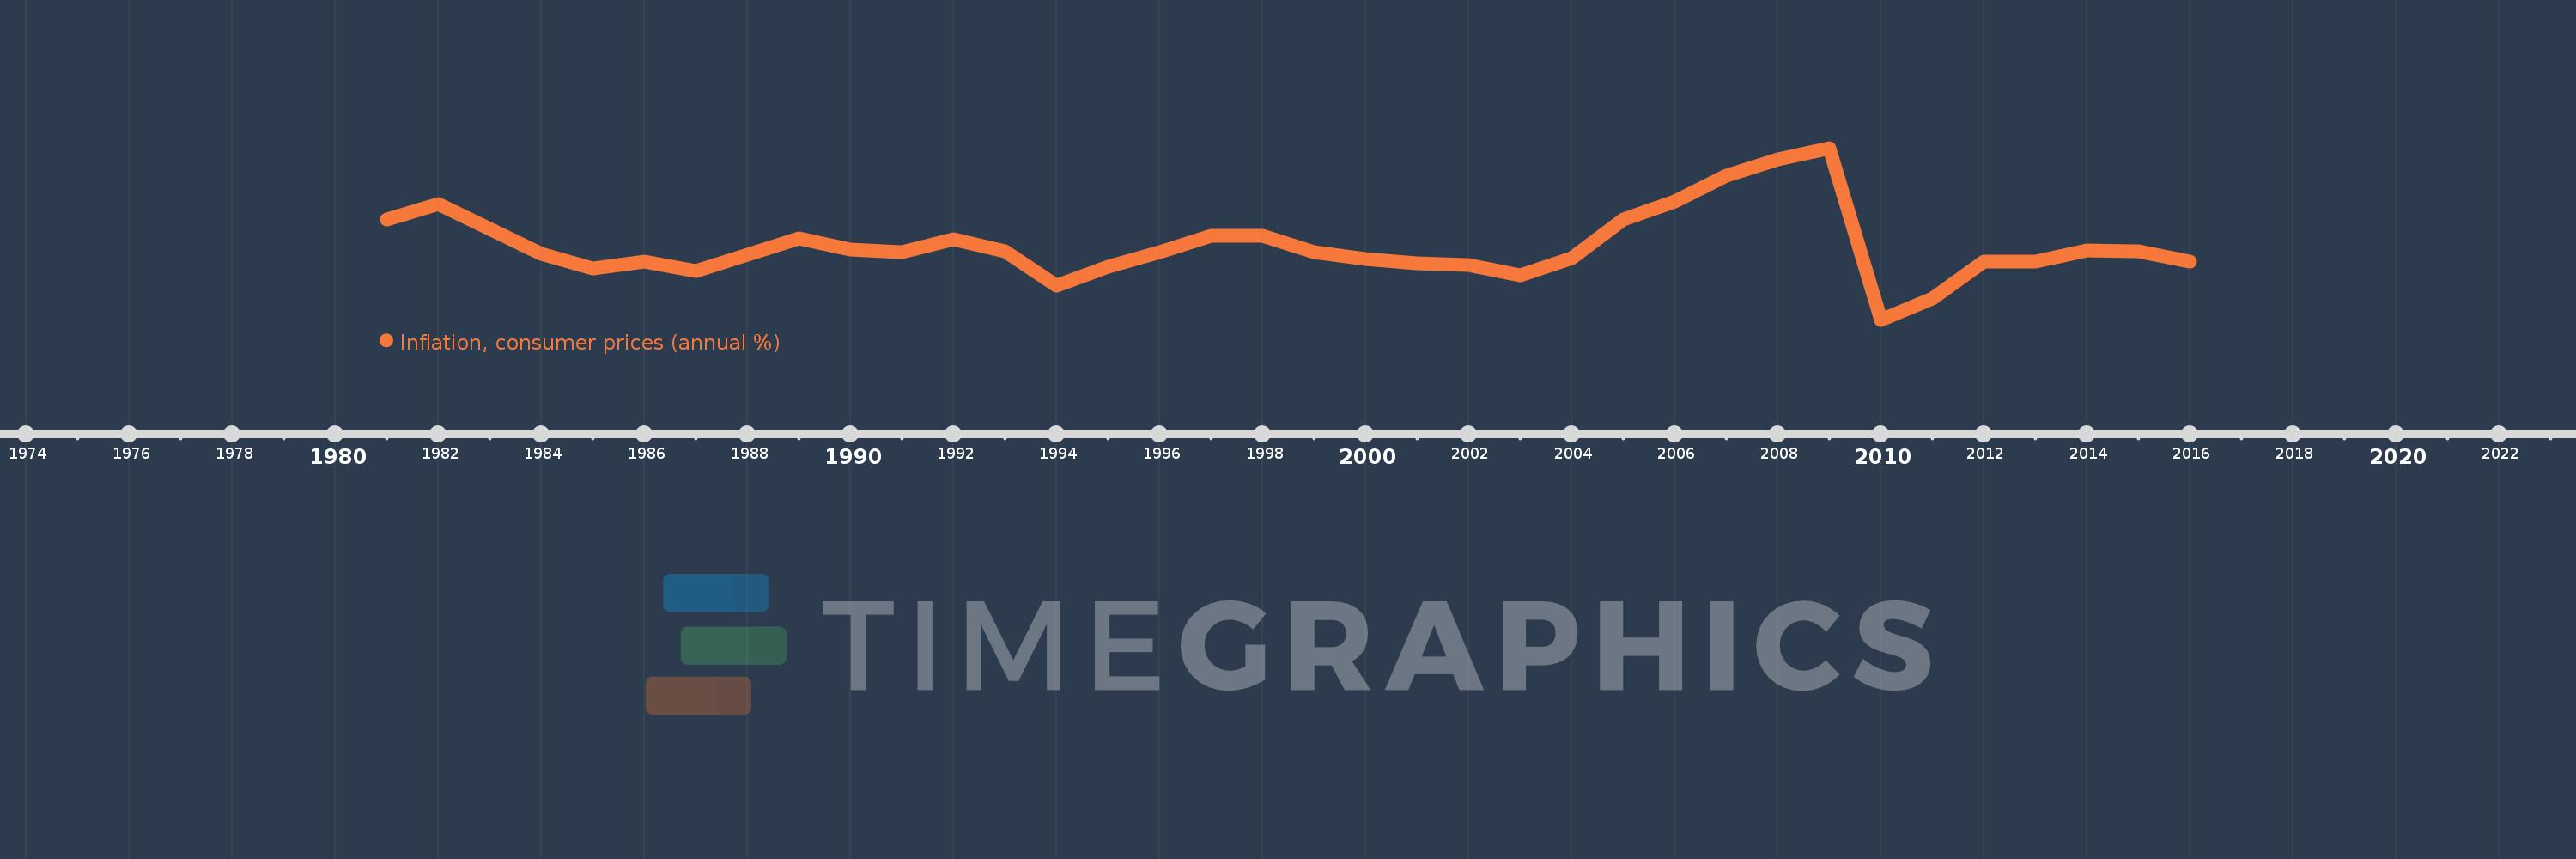
Inflation, consumer prices (annual %)
2016,2015,2014,2013,2012,2011,2010,2009,2008,2007,2006,2005,2004,2003,2002,2001,2000,1999,1998,1997,1996,1995,1994,1993,1992,1991,1990,1989,1988,1987,1986,1985,1984,1983,1982,1981
This statistics in other country:
AfghanistanAlbaniaAlgeriaAngolaAntigua and BarbudaArab WorldArgentinaArmeniaArubaAustraliaAustriaAzerbaijanBahamas, TheBahrainBangladeshBarbadosBelarusBelgiumBelizeBeninBhutanBoliviaBotswanaBrazilBrunei DarussalamBulgariaBurkina FasoBurundiCabo VerdeCambodiaCameroonCanadaCaribbean small statesCentral African RepublicCentral Europe and the BalticsChadChileChinaColombiaComorosCongo, Dem. Rep.Congo, Rep.Costa RicaCote d'IvoireCroatiaCyprusCzech RepublicDenmarkDjiboutiDominicaDominican RepublicEarly-demographic dividendEast Asia & PacificEast Asia & Pacific (excluding high income)East Asia & Pacific (IDA & IBRD countries)EcuadorEgypt, Arab Rep.El SalvadorEquatorial GuineaEstoniaEthiopiaEuro areaEurope & Central AsiaEurope & Central Asia (excluding high income)Europe & Central Asia (IDA & IBRD countries)European UnionFijiFinlandFragile and conflict affected situationsFranceGabonGambia, TheGeorgiaGermanyGhanaGreeceGrenadaGuatemalaGuineaGuinea-BissauGuyanaHaitiHeavily indebted poor countries (HIPC)High incomeHondurasHong Kong SAR, ChinaHungaryIBRD onlyIcelandIDA & IBRD totalIDA blendIDA onlyIDA totalIndiaIndonesiaIran, Islamic Rep.IraqIrelandIsraelItalyJamaicaJapanJordanKazakhstanKenyaKorea, Rep.KuwaitKyrgyz RepublicLao PDRLate-demographic dividendLatin America & Caribbean Latin America & Caribbean (excluding high income)Latin America & the Caribbean (IDA & IBRD countries)LatviaLeast developed countries: UN classificationLebanonLesothoLiberiaLibyaLithuaniaLow & middle incomeLow incomeLower middle incomeLuxembourgMacao SAR, ChinaMacedonia, FYRMadagascarMalawiMalaysiaMaldivesMaliMaltaMauritaniaMauritiusMexicoMiddle East & North AfricaMiddle East & North Africa (excluding high income)Middle East & North Africa (IDA & IBRD countries)Middle incomeMoldovaMongoliaMontenegroMoroccoMozambiqueMyanmarNamibiaNepalNetherlandsNew ZealandNicaraguaNigerNigeriaNorth AmericaNorwayOECD membersOmanOther small statesPakistanPanamaPapua New GuineaParaguayPeruPhilippinesPolandPortugalPost-demographic dividendPre-demographic dividendQatarRomaniaRussian FederationRwandaSamoaSao Tome and PrincipeSaudi ArabiaSenegalSerbiaSeychellesSierra LeoneSingaporeSlovak RepublicSloveniaSmall statesSolomon IslandsSouth AfricaSouth AsiaSouth Asia (IDA & IBRD)South SudanSpainSri LankaSt. Kitts and NevisSt. LuciaSt. Vincent and the GrenadinesSub-Saharan Africa Sub-Saharan Africa (excluding high income)Sub-Saharan Africa (IDA & IBRD countries)SudanSurinameSwazilandSwedenSwitzerlandSyrian Arab RepublicTajikistanTanzaniaThailandTimor-LesteTogoTongaTrinidad and TobagoTunisiaTurkeyUgandaUkraineUnited KingdomUnited StatesUpper middle incomeUruguayVanuatuVenezuela, RBVietnamWorldYemen, Rep.ZambiaZimbabwe Timeline:
This timeline shows a graph from 1981 to 2016 of Qatar. No data until 1980. Number of actual observations by date: 36.
Source name:
World Development Indicators
Source organization:
International Monetary Fund, International Financial Statistics and data files.
Categories, topics:
Economy & Growth, Financial Sector
Last updated:
apr 23, 2017
Indicators value changes by year
Minimum:
-4.863
jan 1, 2010
At the date of observation
Value
Absolute change
Change from previous value
jan 1, 1982
8.521
+1.721
25.3%
jan 1, 1983
5.7
-2.821
-33.1%
jan 1, 1984
2.744
-2.956
-51.87%
jan 1, 1985
1.105
-1.639
-59.73%
jan 1, 1986
1.913
+0.808
73.09%
jan 1, 1987
0.758
-1.155
-60.39%
jan 1, 1988
2.685
+1.928
254.46%
jan 1, 1989
4.603
+1.917
71.4%
jan 1, 1990
3.3
-1.303
-28.3%
jan 1, 1991
3.001
-0.299
-9.06%
jan 1, 1992
4.417
+1.416
47.2%
jan 1, 1993
3.06
-1.357
-30.72%
jan 1, 1994
-0.873
-3.934
-128.54%
jan 1, 1995
1.322
+2.195
-251.32%
jan 1, 1996
2.957
+1.635
123.71%
jan 1, 1997
4.905
+1.948
65.89%
jan 1, 1998
4.834
-0.07
-1.43%
jan 1, 1999
2.951
-1.883
-38.95%
jan 1, 2000
2.182
-0.77
-26.08%
jan 1, 2001
1.65
-0.531
-24.36%
jan 1, 2002
1.471
-0.179
-10.85%
jan 1, 2003
0.24
-1.231
-83.69%
jan 1, 2004
2.265
+2.025
843.57%
jan 1, 2005
6.799
+4.535
200.25%
jan 1, 2006
8.814
+2.015
29.64%
jan 1, 2007
11.836
+3.021
34.28%
jan 1, 2008
13.758
+1.922
16.24%
jan 1, 2009
15.05
+1.292
9.39%
jan 1, 2010
-4.863
-19.913
-132.31%
jan 1, 2011
-2.425
+2.438
-50.13%
jan 1, 2012
1.916
+4.342
-179.02%
jan 1, 2013
1.867
-0.05
-2.6%
jan 1, 2014
3.132
+1.265
67.77%
jan 1, 2015
3.082
-0.049
-1.57%
jan 1, 2016
1.884
-1.199
-38.89%
Ranking of countries by current statistics by years


Comments: