29
/
en
AIzaSyAYiBZKx7MnpbEhh9jyipgxe19OcubqV5w
April 1, 2024
193174
Mauritania
MRT
true
2
1
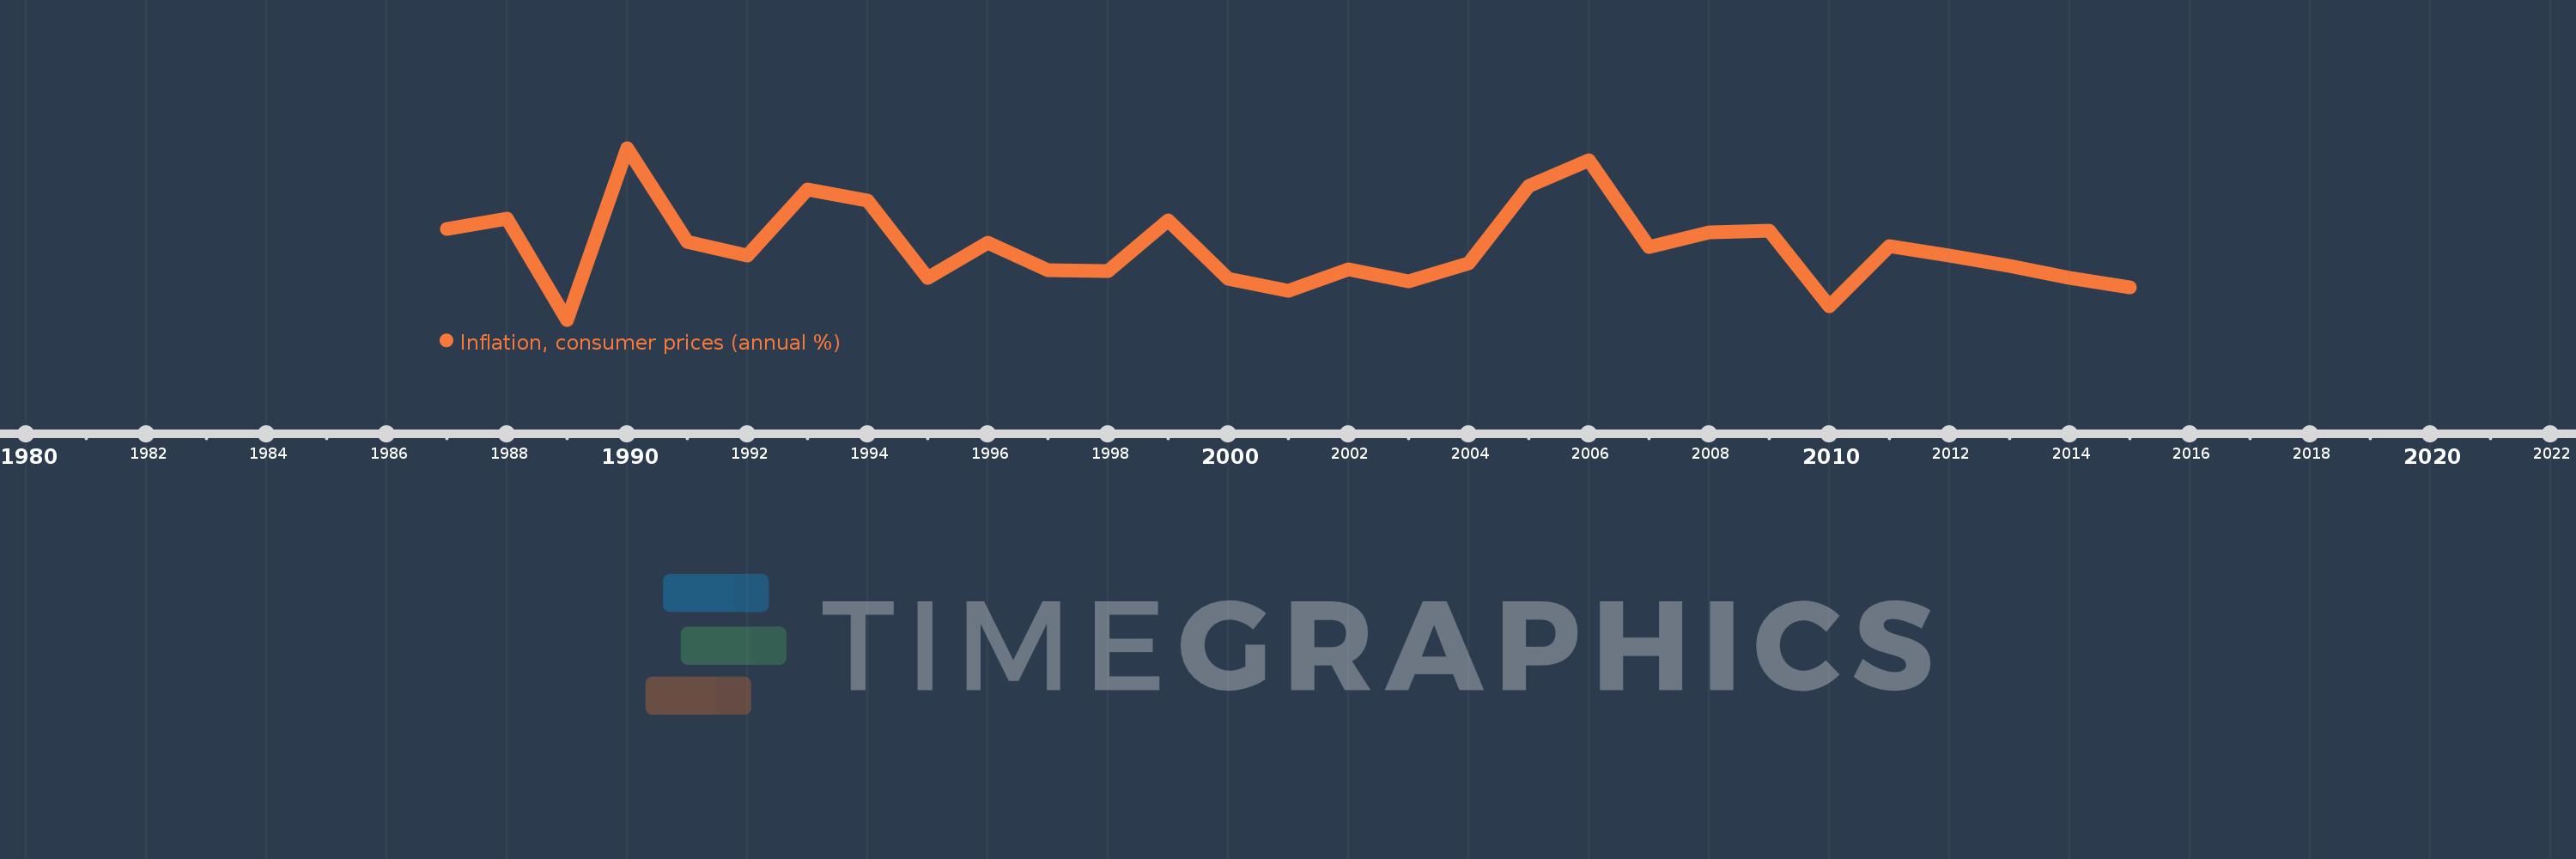
Inflation, consumer prices (annual %)
2015,2014,2013,2012,2011,2010,2009,2008,2007,2006,2005,2004,2003,2002,2001,2000,1999,1998,1997,1996,1995,1994,1993,1992,1991,1990,1989,1988,1987
This statistics in other country:
AfghanistanAlbaniaAlgeriaAngolaAntigua and BarbudaArab WorldArgentinaArmeniaArubaAustraliaAustriaAzerbaijanBahamas, TheBahrainBangladeshBarbadosBelarusBelgiumBelizeBeninBhutanBoliviaBotswanaBrazilBrunei DarussalamBulgariaBurkina FasoBurundiCabo VerdeCambodiaCameroonCanadaCaribbean small statesCentral African RepublicCentral Europe and the BalticsChadChileChinaColombiaComorosCongo, Dem. Rep.Congo, Rep.Costa RicaCote d'IvoireCroatiaCyprusCzech RepublicDenmarkDjiboutiDominicaDominican RepublicEarly-demographic dividendEast Asia & PacificEast Asia & Pacific (excluding high income)East Asia & Pacific (IDA & IBRD countries)EcuadorEgypt, Arab Rep.El SalvadorEquatorial GuineaEstoniaEthiopiaEuro areaEurope & Central AsiaEurope & Central Asia (excluding high income)Europe & Central Asia (IDA & IBRD countries)European UnionFijiFinlandFragile and conflict affected situationsFranceGabonGambia, TheGeorgiaGermanyGhanaGreeceGrenadaGuatemalaGuineaGuinea-BissauGuyanaHaitiHeavily indebted poor countries (HIPC)High incomeHondurasHong Kong SAR, ChinaHungaryIBRD onlyIcelandIDA & IBRD totalIDA blendIDA onlyIDA totalIndiaIndonesiaIran, Islamic Rep.IraqIrelandIsraelItalyJamaicaJapanJordanKazakhstanKenyaKorea, Rep.KuwaitKyrgyz RepublicLao PDRLate-demographic dividendLatin America & Caribbean Latin America & Caribbean (excluding high income)Latin America & the Caribbean (IDA & IBRD countries)LatviaLeast developed countries: UN classificationLebanonLesothoLiberiaLibyaLithuaniaLow & middle incomeLow incomeLower middle incomeLuxembourgMacao SAR, ChinaMacedonia, FYRMadagascarMalawiMalaysiaMaldivesMaliMaltaMauritaniaMauritiusMexicoMiddle East & North AfricaMiddle East & North Africa (excluding high income)Middle East & North Africa (IDA & IBRD countries)Middle incomeMoldovaMongoliaMontenegroMoroccoMozambiqueMyanmarNamibiaNepalNetherlandsNew ZealandNicaraguaNigerNigeriaNorth AmericaNorwayOECD membersOmanOther small statesPakistanPanamaPapua New GuineaParaguayPeruPhilippinesPolandPortugalPost-demographic dividendPre-demographic dividendQatarRomaniaRussian FederationRwandaSamoaSao Tome and PrincipeSaudi ArabiaSenegalSerbiaSeychellesSierra LeoneSingaporeSlovak RepublicSloveniaSmall statesSolomon IslandsSouth AfricaSouth AsiaSouth Asia (IDA & IBRD)South SudanSpainSri LankaSt. Kitts and NevisSt. LuciaSt. Vincent and the GrenadinesSub-Saharan Africa Sub-Saharan Africa (excluding high income)Sub-Saharan Africa (IDA & IBRD countries)SudanSurinameSwazilandSwedenSwitzerlandSyrian Arab RepublicTajikistanTanzaniaThailandTimor-LesteTogoTongaTrinidad and TobagoTunisiaTurkeyUgandaUkraineUnited KingdomUnited StatesUpper middle incomeUruguayVanuatuVenezuela, RBVietnamWorldYemen, Rep.ZambiaZimbabwe Timeline:
This timeline shows a graph from 1987 to 2015 of Mauritania. No data until 1986. Number of actual observations by date: 29.
Source name:
World Development Indicators
Source organization:
International Monetary Fund, International Financial Statistics and data files.
Categories, topics:
Economy & Growth, Financial Sector
Last updated:
apr 23, 2017
Indicators value changes by year
Maximum:
12.933
jan 1, 1990
At the date of observation
Value
Absolute change
Change from previous value
jan 1, 1987
7.433
+7.433
0.0%
jan 1, 1988
8.152
+0.719
9.67%
jan 1, 1989
1.32
-6.833
-83.81%
jan 1, 1990
12.933
+11.613
880.0%
jan 1, 1991
6.6
-6.332
-48.96%
jan 1, 1992
5.629
-0.972
-14.72%
jan 1, 1993
10.142
+4.513
80.18%
jan 1, 1994
9.37
-0.771
-7.61%
jan 1, 1995
4.128
-5.242
-55.94%
jan 1, 1996
6.544
+2.416
58.51%
jan 1, 1997
4.681
-1.862
-28.46%
jan 1, 1998
4.625
-0.056
-1.2%
jan 1, 1999
8.032
+3.406
73.64%
jan 1, 2000
4.074
-3.957
-49.27%
jan 1, 2001
3.254
-0.82
-20.13%
jan 1, 2002
4.715
+1.461
44.89%
jan 1, 2003
3.896
-0.819
-17.37%
jan 1, 2004
5.152
+1.256
32.25%
jan 1, 2005
10.368
+5.216
101.24%
jan 1, 2006
12.126
+1.758
16.96%
jan 1, 2007
6.241
-5.885
-48.53%
jan 1, 2008
7.254
+1.013
16.23%
jan 1, 2009
7.347
+0.093
1.28%
jan 1, 2010
2.221
-5.126
-69.77%
jan 1, 2011
6.284
+4.063
182.93%
jan 1, 2012
5.642
-0.641
-10.2%
jan 1, 2013
4.936
-0.707
-12.52%
jan 1, 2014
4.13
-0.806
-16.33%
jan 1, 2015
3.535
-0.594
-14.39%
Ranking of countries by current statistics by years


Comments: