29
/
en
AIzaSyAYiBZKx7MnpbEhh9jyipgxe19OcubqV5w
April 1, 2024
161612
Italy
ITA
true
2
1
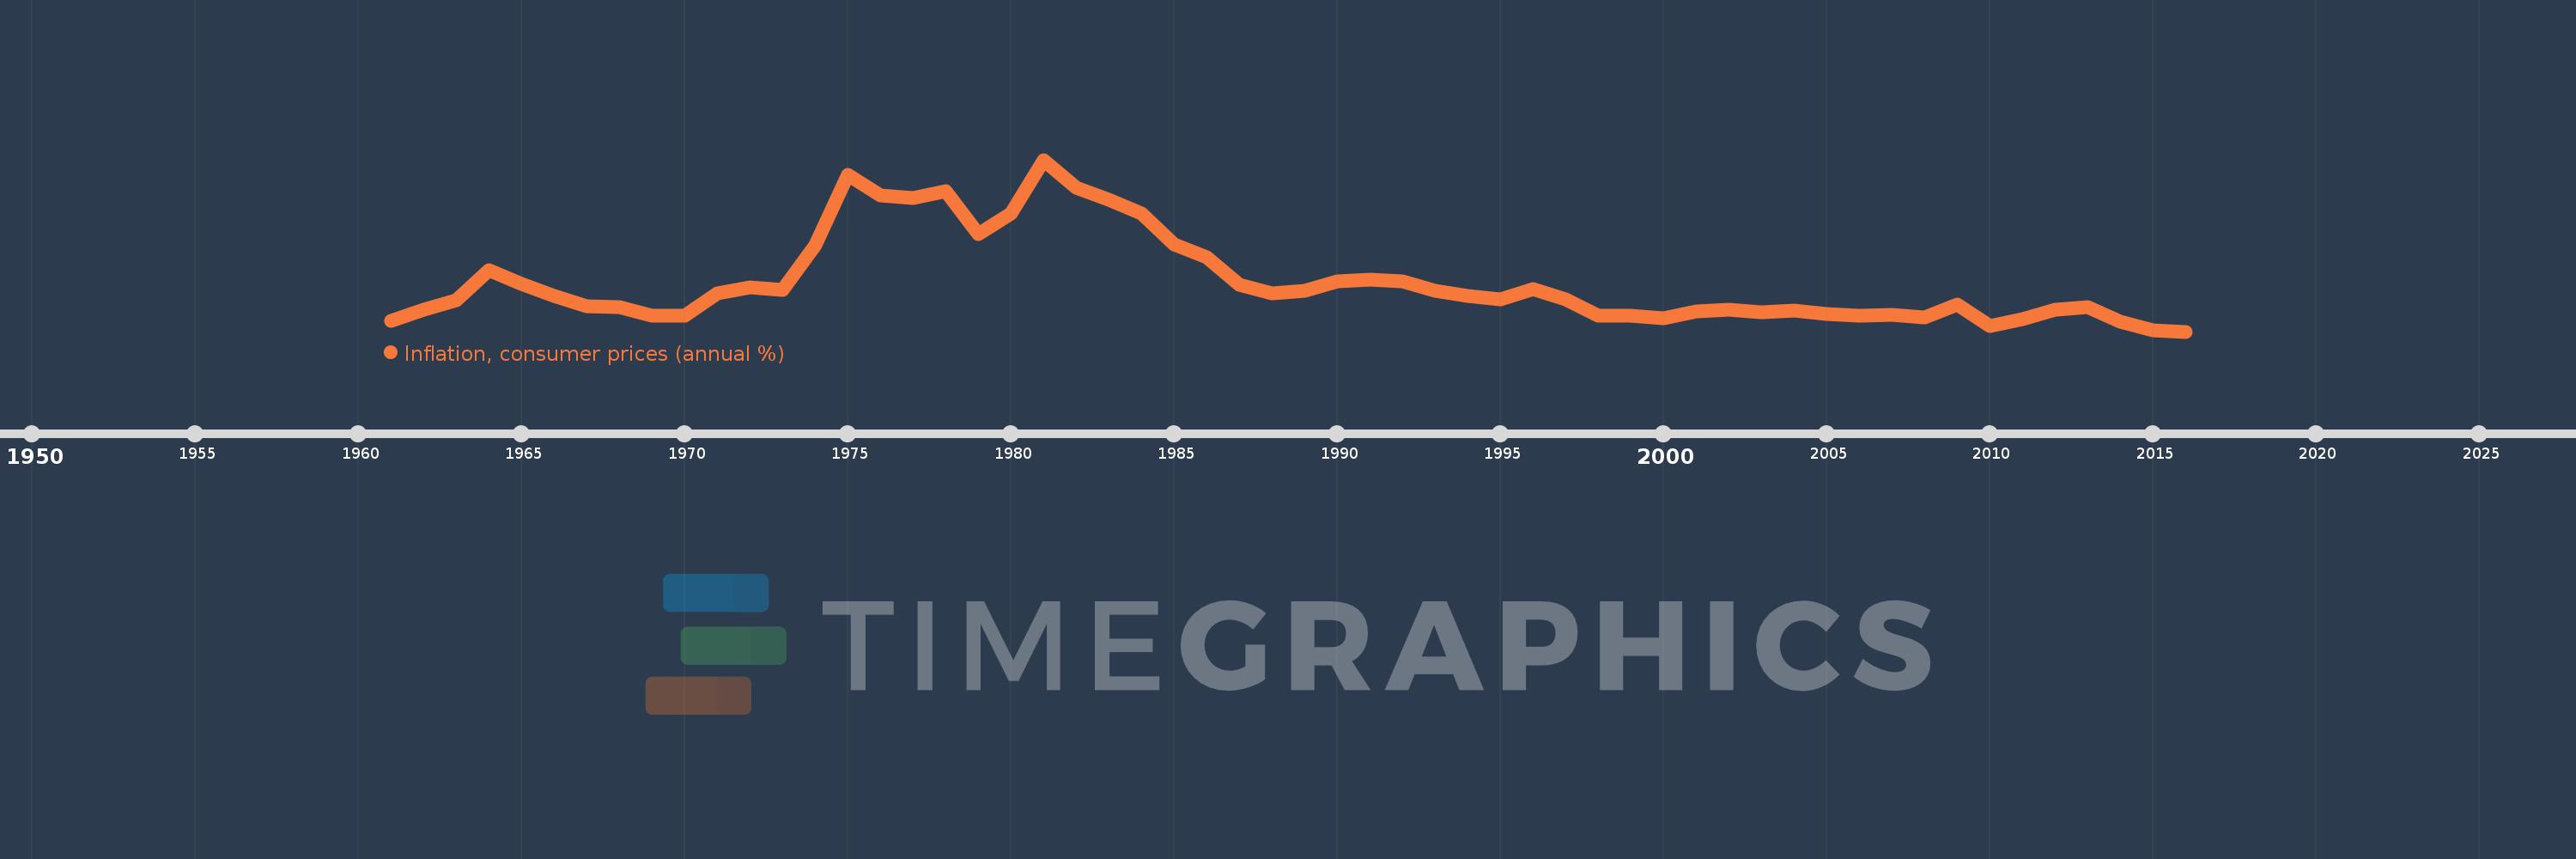
Inflation, consumer prices (annual %)
2016,2015,2014,2013,2012,2011,2010,2009,2008,2007,2006,2005,2004,2003,2002,2001,2000,1999,1998,1997,1996,1995,1994,1993,1992,1991,1990,1989,1988,1987,1986,1985,1984,1983,1982,1981,1980,1979,1978,1977,1976,1975,1974,1973,1972,1971,1970,1969,1968,1967,1966,1965,1964,1963,1962,1961
This statistics in other country:
AfghanistanAlbaniaAlgeriaAngolaAntigua and BarbudaArab WorldArgentinaArmeniaArubaAustraliaAustriaAzerbaijanBahamas, TheBahrainBangladeshBarbadosBelarusBelgiumBelizeBeninBhutanBoliviaBotswanaBrazilBrunei DarussalamBulgariaBurkina FasoBurundiCabo VerdeCambodiaCameroonCanadaCaribbean small statesCentral African RepublicCentral Europe and the BalticsChadChileChinaColombiaComorosCongo, Dem. Rep.Congo, Rep.Costa RicaCote d'IvoireCroatiaCyprusCzech RepublicDenmarkDjiboutiDominicaDominican RepublicEarly-demographic dividendEast Asia & PacificEast Asia & Pacific (excluding high income)East Asia & Pacific (IDA & IBRD countries)EcuadorEgypt, Arab Rep.El SalvadorEquatorial GuineaEstoniaEthiopiaEuro areaEurope & Central AsiaEurope & Central Asia (excluding high income)Europe & Central Asia (IDA & IBRD countries)European UnionFijiFinlandFragile and conflict affected situationsFranceGabonGambia, TheGeorgiaGermanyGhanaGreeceGrenadaGuatemalaGuineaGuinea-BissauGuyanaHaitiHeavily indebted poor countries (HIPC)High incomeHondurasHong Kong SAR, ChinaHungaryIBRD onlyIcelandIDA & IBRD totalIDA blendIDA onlyIDA totalIndiaIndonesiaIran, Islamic Rep.IraqIrelandIsraelItalyJamaicaJapanJordanKazakhstanKenyaKorea, Rep.KuwaitKyrgyz RepublicLao PDRLate-demographic dividendLatin America & Caribbean Latin America & Caribbean (excluding high income)Latin America & the Caribbean (IDA & IBRD countries)LatviaLeast developed countries: UN classificationLebanonLesothoLiberiaLibyaLithuaniaLow & middle incomeLow incomeLower middle incomeLuxembourgMacao SAR, ChinaMacedonia, FYRMadagascarMalawiMalaysiaMaldivesMaliMaltaMauritaniaMauritiusMexicoMiddle East & North AfricaMiddle East & North Africa (excluding high income)Middle East & North Africa (IDA & IBRD countries)Middle incomeMoldovaMongoliaMontenegroMoroccoMozambiqueMyanmarNamibiaNepalNetherlandsNew ZealandNicaraguaNigerNigeriaNorth AmericaNorwayOECD membersOmanOther small statesPakistanPanamaPapua New GuineaParaguayPeruPhilippinesPolandPortugalPost-demographic dividendPre-demographic dividendQatarRomaniaRussian FederationRwandaSamoaSao Tome and PrincipeSaudi ArabiaSenegalSerbiaSeychellesSierra LeoneSingaporeSlovak RepublicSloveniaSmall statesSolomon IslandsSouth AfricaSouth AsiaSouth Asia (IDA & IBRD)South SudanSpainSri LankaSt. Kitts and NevisSt. LuciaSt. Vincent and the GrenadinesSub-Saharan Africa Sub-Saharan Africa (excluding high income)Sub-Saharan Africa (IDA & IBRD countries)SudanSurinameSwazilandSwedenSwitzerlandSyrian Arab RepublicTajikistanTanzaniaThailandTimor-LesteTogoTongaTrinidad and TobagoTunisiaTurkeyUgandaUkraineUnited KingdomUnited StatesUpper middle incomeUruguayVanuatuVenezuela, RBVietnamWorldYemen, Rep.ZambiaZimbabwe Timeline:
This timeline shows a graph from 1961 to 2016 of Italy. No data until 1960. Number of actual observations by date: 56.
Source name:
World Development Indicators
Source organization:
International Monetary Fund, International Financial Statistics and data files.
Categories, topics:
Economy & Growth, Financial Sector
Last updated:
apr 23, 2017
Indicators value changes by year
Maximum:
21.277
jan 1, 1981
At the date of observation
Value
Absolute change
Change from previous value
jan 1, 1961
1.37
+1.37
0.0%
jan 1, 1962
2.703
+1.333
97.3%
jan 1, 1963
3.947
+1.245
46.05%
jan 1, 1964
7.595
+3.648
92.41%
jan 1, 1965
5.882
-1.713
-22.55%
jan 1, 1966
4.444
-1.438
-24.44%
jan 1, 1967
3.191
-1.253
-28.19%
jan 1, 1968
3.093
-0.099
-3.09%
jan 1, 1969
2.0
-1.093
-35.33%
jan 1, 1970
1.961
-0.039
-1.96%
jan 1, 1971
4.808
+2.847
145.19%
jan 1, 1972
5.505
+0.697
14.5%
jan 1, 1973
5.217
-0.287
-5.22%
jan 1, 1974
10.744
+5.526
105.92%
jan 1, 1975
19.403
+8.659
80.6%
jan 1, 1976
16.875
-2.528
-13.03%
jan 1, 1977
16.578
-0.297
-1.76%
jan 1, 1978
17.431
+0.854
5.15%
jan 1, 1979
12.109
-5.322
-30.53%
jan 1, 1980
14.634
+2.525
20.85%
jan 1, 1981
21.277
+6.642
45.39%
jan 1, 1982
17.794
-3.482
-16.37%
jan 1, 1983
16.383
-1.412
-7.93%
jan 1, 1984
14.625
-1.758
-10.73%
jan 1, 1985
10.845
-3.78
-25.85%
jan 1, 1986
9.209
-1.637
-15.09%
jan 1, 1987
5.797
-3.412
-37.05%
jan 1, 1988
4.732
-1.065
-18.37%
jan 1, 1989
5.113
+0.381
8.04%
jan 1, 1990
6.222
+1.109
21.69%
jan 1, 1991
6.496
+0.275
4.41%
jan 1, 1992
6.3
-0.196
-3.02%
jan 1, 1993
5.08
-1.22
-19.37%
jan 1, 1994
4.476
-0.604
-11.88%
jan 1, 1995
4.027
-0.449
-10.03%
jan 1, 1996
5.244
+1.217
30.22%
jan 1, 1997
3.975
-1.27
-24.21%
jan 1, 1998
2.043
-1.931
-48.59%
jan 1, 1999
1.963
-0.08
-3.92%
jan 1, 2000
1.656
-0.307
-15.66%
jan 1, 2001
2.519
+0.864
52.17%
jan 1, 2002
2.788
+0.268
10.66%
jan 1, 2003
2.461
-0.327
-11.72%
jan 1, 2004
2.676
+0.215
8.75%
jan 1, 2005
2.215
-0.461
-17.23%
jan 1, 2006
1.999
-0.216
-9.76%
jan 1, 2007
2.07
+0.071
3.54%
jan 1, 2008
1.821
-0.248
-12.0%
jan 1, 2009
3.375
+1.554
85.29%
jan 1, 2010
0.75
-2.625
-77.77%
jan 1, 2011
1.54
+0.79
105.28%
jan 1, 2012
2.741
+1.202
78.03%
jan 1, 2013
3.041
+0.3
10.94%
jan 1, 2014
1.22
-1.821
-59.89%
jan 1, 2015
0.241
-0.979
-80.24%
jan 1, 2016
0.039
-0.202
-83.91%
Ranking of countries by current statistics by years


Comments: