29
/
en
AIzaSyAYiBZKx7MnpbEhh9jyipgxe19OcubqV5w
April 1, 2024
240580
Singapore
SGP
true
2
1
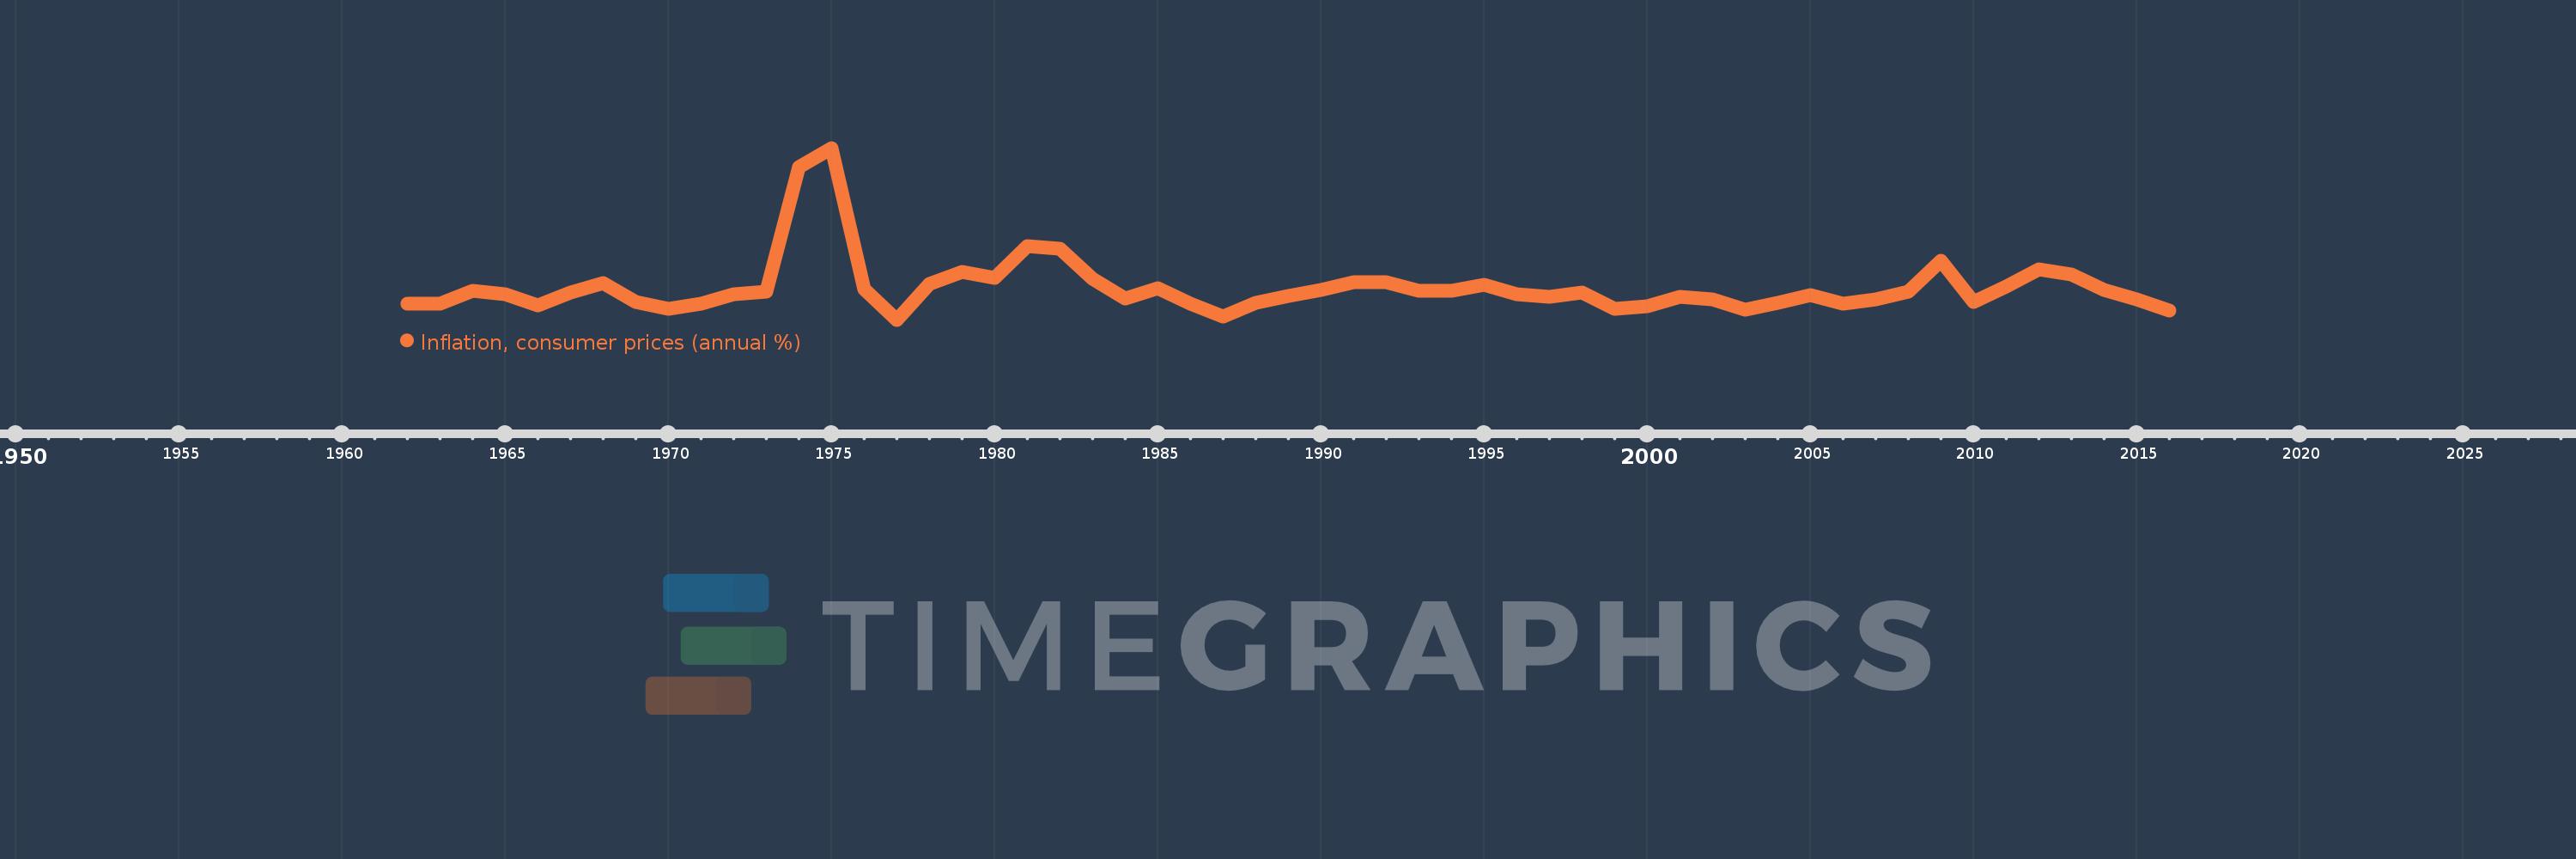
Inflation, consumer prices (annual %)
2016,2015,2014,2013,2012,2011,2010,2009,2008,2007,2006,2005,2004,2003,2002,2001,2000,1999,1998,1997,1996,1995,1994,1993,1992,1991,1990,1989,1988,1987,1986,1985,1984,1983,1982,1981,1980,1979,1978,1977,1976,1975,1974,1973,1972,1971,1970,1969,1968,1967,1966,1965,1964,1963,1962
This statistics in other country:
AfghanistanAlbaniaAlgeriaAngolaAntigua and BarbudaArab WorldArgentinaArmeniaArubaAustraliaAustriaAzerbaijanBahamas, TheBahrainBangladeshBarbadosBelarusBelgiumBelizeBeninBhutanBoliviaBotswanaBrazilBrunei DarussalamBulgariaBurkina FasoBurundiCabo VerdeCambodiaCameroonCanadaCaribbean small statesCentral African RepublicCentral Europe and the BalticsChadChileChinaColombiaComorosCongo, Dem. Rep.Congo, Rep.Costa RicaCote d'IvoireCroatiaCyprusCzech RepublicDenmarkDjiboutiDominicaDominican RepublicEarly-demographic dividendEast Asia & PacificEast Asia & Pacific (excluding high income)East Asia & Pacific (IDA & IBRD countries)EcuadorEgypt, Arab Rep.El SalvadorEquatorial GuineaEstoniaEthiopiaEuro areaEurope & Central AsiaEurope & Central Asia (excluding high income)Europe & Central Asia (IDA & IBRD countries)European UnionFijiFinlandFragile and conflict affected situationsFranceGabonGambia, TheGeorgiaGermanyGhanaGreeceGrenadaGuatemalaGuineaGuinea-BissauGuyanaHaitiHeavily indebted poor countries (HIPC)High incomeHondurasHong Kong SAR, ChinaHungaryIBRD onlyIcelandIDA & IBRD totalIDA blendIDA onlyIDA totalIndiaIndonesiaIran, Islamic Rep.IraqIrelandIsraelItalyJamaicaJapanJordanKazakhstanKenyaKorea, Rep.KuwaitKyrgyz RepublicLao PDRLate-demographic dividendLatin America & Caribbean Latin America & Caribbean (excluding high income)Latin America & the Caribbean (IDA & IBRD countries)LatviaLeast developed countries: UN classificationLebanonLesothoLiberiaLibyaLithuaniaLow & middle incomeLow incomeLower middle incomeLuxembourgMacao SAR, ChinaMacedonia, FYRMadagascarMalawiMalaysiaMaldivesMaliMaltaMauritaniaMauritiusMexicoMiddle East & North AfricaMiddle East & North Africa (excluding high income)Middle East & North Africa (IDA & IBRD countries)Middle incomeMoldovaMongoliaMontenegroMoroccoMozambiqueMyanmarNamibiaNepalNetherlandsNew ZealandNicaraguaNigerNigeriaNorth AmericaNorwayOECD membersOmanOther small statesPakistanPanamaPapua New GuineaParaguayPeruPhilippinesPolandPortugalPost-demographic dividendPre-demographic dividendQatarRomaniaRussian FederationRwandaSamoaSao Tome and PrincipeSaudi ArabiaSenegalSerbiaSeychellesSierra LeoneSingaporeSlovak RepublicSloveniaSmall statesSolomon IslandsSouth AfricaSouth AsiaSouth Asia (IDA & IBRD)South SudanSpainSri LankaSt. Kitts and NevisSt. LuciaSt. Vincent and the GrenadinesSub-Saharan Africa Sub-Saharan Africa (excluding high income)Sub-Saharan Africa (IDA & IBRD countries)SudanSurinameSwazilandSwedenSwitzerlandSyrian Arab RepublicTajikistanTanzaniaThailandTimor-LesteTogoTongaTrinidad and TobagoTunisiaTurkeyUgandaUkraineUnited KingdomUnited StatesUpper middle incomeUruguayVanuatuVenezuela, RBVietnamWorldYemen, Rep.ZambiaZimbabwe Timeline:
This timeline shows a graph from 1962 to 2016 of Singapore. No data until 1961. Number of actual observations by date: 55.
Source name:
World Development Indicators
Source organization:
International Monetary Fund, International Financial Statistics and data files.
Categories, topics:
Economy & Growth, Financial Sector
Last updated:
apr 23, 2017
Indicators value changes by year
Minimum:
-1.842
jan 1, 1977
Maximum:
22.368
jan 1, 1975
At the date of observation
Value
Absolute change
Change from previous value
jan 1, 1963
0.42
+0.02
4.9%
jan 1, 1964
2.205
+1.786
425.57%
jan 1, 1965
1.726
-0.479
-21.73%
jan 1, 1966
0.179
-1.547
-89.65%
jan 1, 1967
2.006
+1.827
1.02K%
jan 1, 1968
3.343
+1.337
66.66%
jan 1, 1969
0.655
-2.687
-80.39%
jan 1, 1970
-0.273
-0.928
-141.66%
jan 1, 1971
0.463
+0.736
-269.69%
jan 1, 1972
1.761
+1.298
280.06%
jan 1, 1973
2.081
+0.32
18.16%
jan 1, 1974
19.637
+17.556
843.73%
jan 1, 1975
22.368
+2.732
13.91%
jan 1, 1976
2.537
-19.832
-88.66%
jan 1, 1977
-1.842
-4.378
-172.61%
jan 1, 1978
3.164
+5.006
-271.78%
jan 1, 1979
4.873
+1.709
54.0%
jan 1, 1980
4.076
-0.796
-16.34%
jan 1, 1981
8.527
+4.45
109.17%
jan 1, 1982
8.182
-0.345
-4.05%
jan 1, 1983
3.916
-4.266
-52.14%
jan 1, 1984
1.196
-2.72
-69.45%
jan 1, 1985
2.601
+1.405
117.4%
jan 1, 1986
0.48
-2.121
-81.54%
jan 1, 1987
-1.386
-1.866
-388.61%
jan 1, 1988
0.523
+1.909
-137.76%
jan 1, 1989
1.523
+1.0
191.07%
jan 1, 1990
2.345
+0.822
53.98%
jan 1, 1991
3.461
+1.115
47.55%
jan 1, 1992
3.426
-0.035
-1.01%
jan 1, 1993
2.263
-1.163
-33.94%
jan 1, 1994
2.289
+0.026
1.16%
jan 1, 1995
3.1
+0.811
35.42%
jan 1, 1996
1.721
-1.38
-44.5%
jan 1, 1997
1.383
-0.337
-19.61%
jan 1, 1998
2.004
+0.62
44.85%
jan 1, 1999
-0.268
-2.271
-113.35%
jan 1, 2000
0.017
+0.284
-106.25%
jan 1, 2001
1.362
+1.345
8.05K%
jan 1, 2002
0.997
-0.364
-26.76%
jan 1, 2003
-0.392
-1.389
-139.28%
jan 1, 2004
0.508
+0.9
-229.67%
jan 1, 2005
1.663
+1.155
227.37%
jan 1, 2006
0.425
-1.238
-74.43%
jan 1, 2007
1.021
+0.596
140.16%
jan 1, 2008
2.095
+1.074
105.22%
jan 1, 2009
6.519
+4.423
211.13%
jan 1, 2010
0.604
-5.915
-90.74%
jan 1, 2011
2.8
+2.196
363.87%
jan 1, 2012
5.253
+2.453
87.6%
jan 1, 2013
4.529
-0.724
-13.79%
jan 1, 2014
2.378
-2.15
-47.48%
jan 1, 2015
1.01
-1.368
-57.53%
jan 1, 2016
-0.542
-1.552
-153.63%
Ranking of countries by current statistics by years


Comments: