29
/
en
AIzaSyAYiBZKx7MnpbEhh9jyipgxe19OcubqV5w
April 1, 2024
89959
Botswana
BWA
true
2
1
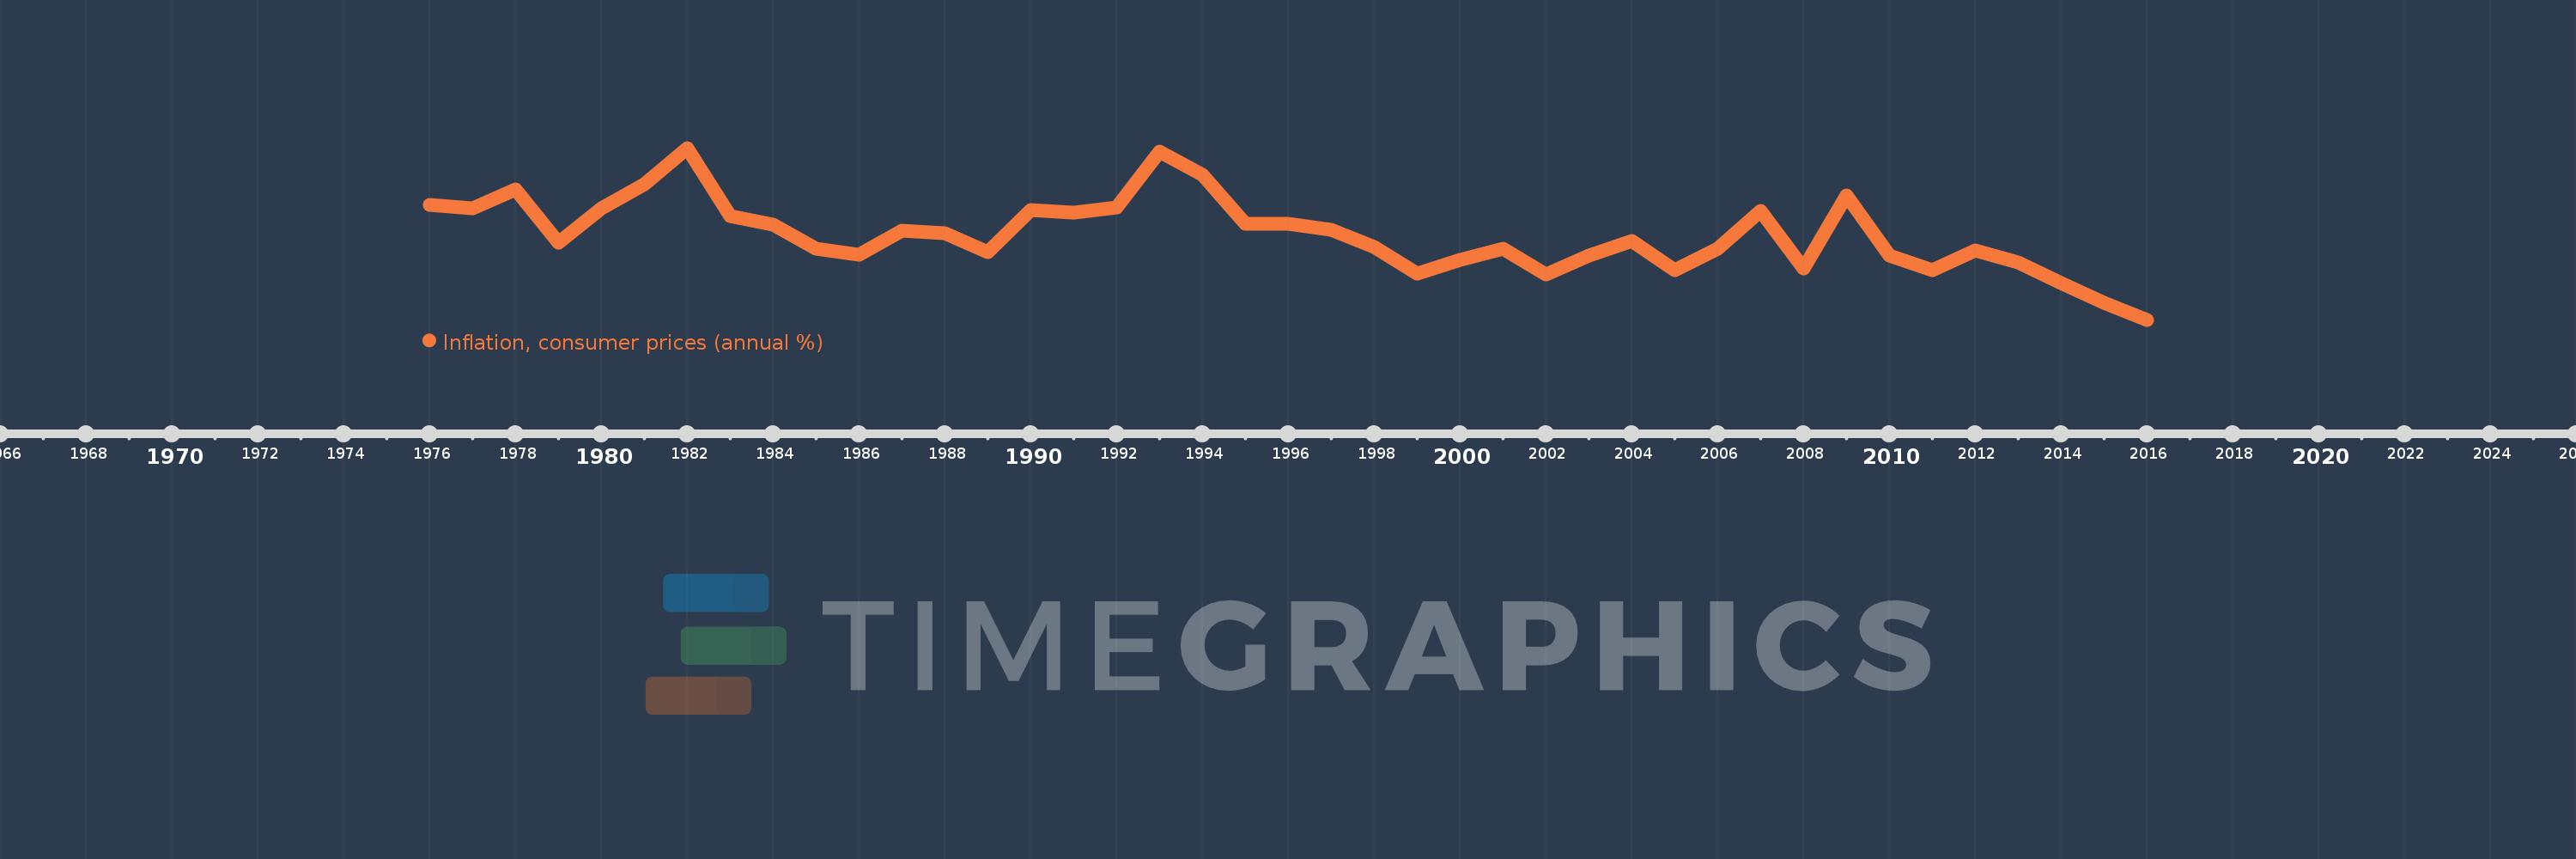
Inflation, consumer prices (annual %)
2016,2015,2014,2013,2012,2011,2010,2009,2008,2007,2006,2005,2004,2003,2002,2001,2000,1999,1998,1997,1996,1995,1994,1993,1992,1991,1990,1989,1988,1987,1986,1985,1984,1983,1982,1981,1980,1979,1978,1977,1976
This statistics in other country:
AfghanistanAlbaniaAlgeriaAngolaAntigua and BarbudaArab WorldArgentinaArmeniaArubaAustraliaAustriaAzerbaijanBahamas, TheBahrainBangladeshBarbadosBelarusBelgiumBelizeBeninBhutanBoliviaBotswanaBrazilBrunei DarussalamBulgariaBurkina FasoBurundiCabo VerdeCambodiaCameroonCanadaCaribbean small statesCentral African RepublicCentral Europe and the BalticsChadChileChinaColombiaComorosCongo, Dem. Rep.Congo, Rep.Costa RicaCote d'IvoireCroatiaCyprusCzech RepublicDenmarkDjiboutiDominicaDominican RepublicEarly-demographic dividendEast Asia & PacificEast Asia & Pacific (excluding high income)East Asia & Pacific (IDA & IBRD countries)EcuadorEgypt, Arab Rep.El SalvadorEquatorial GuineaEstoniaEthiopiaEuro areaEurope & Central AsiaEurope & Central Asia (excluding high income)Europe & Central Asia (IDA & IBRD countries)European UnionFijiFinlandFragile and conflict affected situationsFranceGabonGambia, TheGeorgiaGermanyGhanaGreeceGrenadaGuatemalaGuineaGuinea-BissauGuyanaHaitiHeavily indebted poor countries (HIPC)High incomeHondurasHong Kong SAR, ChinaHungaryIBRD onlyIcelandIDA & IBRD totalIDA blendIDA onlyIDA totalIndiaIndonesiaIran, Islamic Rep.IraqIrelandIsraelItalyJamaicaJapanJordanKazakhstanKenyaKorea, Rep.KuwaitKyrgyz RepublicLao PDRLate-demographic dividendLatin America & Caribbean Latin America & Caribbean (excluding high income)Latin America & the Caribbean (IDA & IBRD countries)LatviaLeast developed countries: UN classificationLebanonLesothoLiberiaLibyaLithuaniaLow & middle incomeLow incomeLower middle incomeLuxembourgMacao SAR, ChinaMacedonia, FYRMadagascarMalawiMalaysiaMaldivesMaliMaltaMauritaniaMauritiusMexicoMiddle East & North AfricaMiddle East & North Africa (excluding high income)Middle East & North Africa (IDA & IBRD countries)Middle incomeMoldovaMongoliaMontenegroMoroccoMozambiqueMyanmarNamibiaNepalNetherlandsNew ZealandNicaraguaNigerNigeriaNorth AmericaNorwayOECD membersOmanOther small statesPakistanPanamaPapua New GuineaParaguayPeruPhilippinesPolandPortugalPost-demographic dividendPre-demographic dividendQatarRomaniaRussian FederationRwandaSamoaSao Tome and PrincipeSaudi ArabiaSenegalSerbiaSeychellesSierra LeoneSingaporeSlovak RepublicSloveniaSmall statesSolomon IslandsSouth AfricaSouth AsiaSouth Asia (IDA & IBRD)South SudanSpainSri LankaSt. Kitts and NevisSt. LuciaSt. Vincent and the GrenadinesSub-Saharan Africa Sub-Saharan Africa (excluding high income)Sub-Saharan Africa (IDA & IBRD countries)SudanSurinameSwazilandSwedenSwitzerlandSyrian Arab RepublicTajikistanTanzaniaThailandTimor-LesteTogoTongaTrinidad and TobagoTunisiaTurkeyUgandaUkraineUnited KingdomUnited StatesUpper middle incomeUruguayVanuatuVenezuela, RBVietnamWorldYemen, Rep.ZambiaZimbabwe Timeline:
This timeline shows a graph from 1976 to 2016 of Botswana. No data until 1975. Number of actual observations by date: 41.
Source name:
World Development Indicators
Source organization:
International Monetary Fund, International Financial Statistics and data files.
Categories, topics:
Economy & Growth, Financial Sector
Last updated:
apr 23, 2017
Indicators value changes by year
Maximum:
16.428
jan 1, 1982
At the date of observation
Value
Absolute change
Change from previous value
jan 1, 1976
11.975
+11.975
0.0%
jan 1, 1977
11.732
-0.242
-2.02%
jan 1, 1978
13.169
+1.436
12.24%
jan 1, 1979
9.044
-4.125
-31.32%
jan 1, 1980
11.736
+2.692
29.77%
jan 1, 1981
13.632
+1.896
16.16%
jan 1, 1982
16.428
+2.796
20.51%
jan 1, 1983
11.137
-5.291
-32.21%
jan 1, 1984
10.477
-0.66
-5.93%
jan 1, 1985
8.577
-1.9
-18.13%
jan 1, 1986
8.095
-0.483
-5.63%
jan 1, 1987
10.002
+1.907
23.56%
jan 1, 1988
9.802
-0.2
-2.0%
jan 1, 1989
8.352
-1.45
-14.8%
jan 1, 1990
11.575
+3.223
38.6%
jan 1, 1991
11.396
-0.179
-1.54%
jan 1, 1992
11.765
+0.369
3.23%
jan 1, 1993
16.168
+4.403
37.42%
jan 1, 1994
14.331
-1.837
-11.36%
jan 1, 1995
10.543
-3.788
-26.43%
jan 1, 1996
10.513
-0.03
-0.29%
jan 1, 1997
10.083
-0.43
-4.09%
jan 1, 1998
8.72
-1.363
-13.52%
jan 1, 1999
6.661
-2.059
-23.61%
jan 1, 2000
7.749
+1.088
16.33%
jan 1, 2001
8.601
+0.852
11.0%
jan 1, 2002
6.559
-2.042
-23.75%
jan 1, 2003
8.033
+1.474
22.47%
jan 1, 2004
9.19
+1.157
14.4%
jan 1, 2005
6.946
-2.244
-24.42%
jan 1, 2006
8.61
+1.665
23.96%
jan 1, 2007
11.555
+2.945
34.2%
jan 1, 2008
7.081
-4.474
-38.72%
jan 1, 2009
12.702
+5.621
79.38%
jan 1, 2010
8.027
-4.675
-36.8%
jan 1, 2011
6.949
-1.078
-13.43%
jan 1, 2012
8.458
+1.509
21.72%
jan 1, 2013
7.54
-0.918
-10.85%
jan 1, 2014
5.884
-1.656
-21.97%
jan 1, 2015
4.403
-1.481
-25.17%
jan 1, 2016
3.06
-1.343
-30.5%
Ranking of countries by current statistics by years


Comments: