29
/
en
AIzaSyAYiBZKx7MnpbEhh9jyipgxe19OcubqV5w
April 1, 2024
171836
Kuwait
KWT
true
2
1
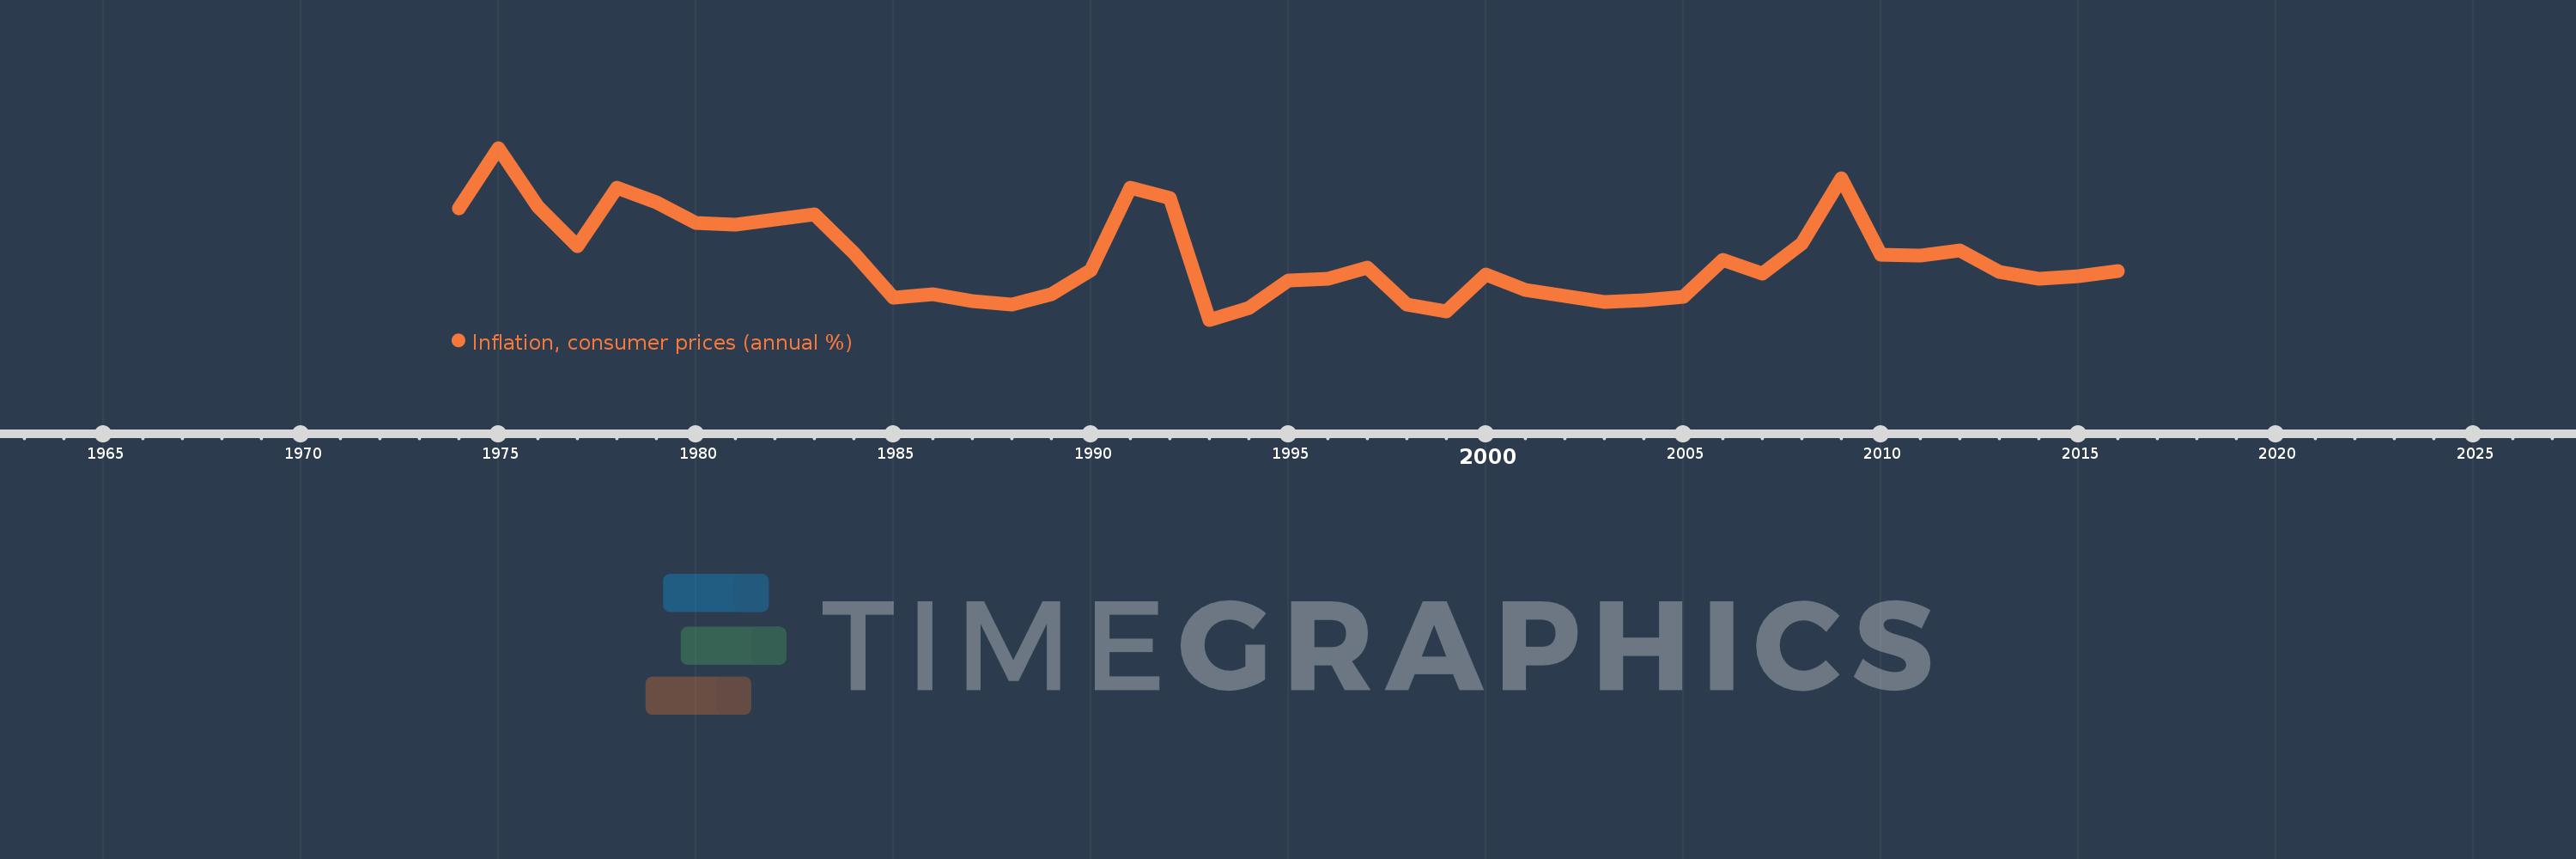
Inflation, consumer prices (annual %)
2016,2015,2014,2013,2012,2011,2010,2009,2008,2007,2006,2005,2004,2003,2002,2001,2000,1999,1998,1997,1996,1995,1994,1993,1992,1991,1990,1989,1988,1987,1986,1985,1984,1983,1982,1981,1980,1979,1978,1977,1976,1975,1974
This statistics in other country:
AfghanistanAlbaniaAlgeriaAngolaAntigua and BarbudaArab WorldArgentinaArmeniaArubaAustraliaAustriaAzerbaijanBahamas, TheBahrainBangladeshBarbadosBelarusBelgiumBelizeBeninBhutanBoliviaBotswanaBrazilBrunei DarussalamBulgariaBurkina FasoBurundiCabo VerdeCambodiaCameroonCanadaCaribbean small statesCentral African RepublicCentral Europe and the BalticsChadChileChinaColombiaComorosCongo, Dem. Rep.Congo, Rep.Costa RicaCote d'IvoireCroatiaCyprusCzech RepublicDenmarkDjiboutiDominicaDominican RepublicEarly-demographic dividendEast Asia & PacificEast Asia & Pacific (excluding high income)East Asia & Pacific (IDA & IBRD countries)EcuadorEgypt, Arab Rep.El SalvadorEquatorial GuineaEstoniaEthiopiaEuro areaEurope & Central AsiaEurope & Central Asia (excluding high income)Europe & Central Asia (IDA & IBRD countries)European UnionFijiFinlandFragile and conflict affected situationsFranceGabonGambia, TheGeorgiaGermanyGhanaGreeceGrenadaGuatemalaGuineaGuinea-BissauGuyanaHaitiHeavily indebted poor countries (HIPC)High incomeHondurasHong Kong SAR, ChinaHungaryIBRD onlyIcelandIDA & IBRD totalIDA blendIDA onlyIDA totalIndiaIndonesiaIran, Islamic Rep.IraqIrelandIsraelItalyJamaicaJapanJordanKazakhstanKenyaKorea, Rep.KuwaitKyrgyz RepublicLao PDRLate-demographic dividendLatin America & Caribbean Latin America & Caribbean (excluding high income)Latin America & the Caribbean (IDA & IBRD countries)LatviaLeast developed countries: UN classificationLebanonLesothoLiberiaLibyaLithuaniaLow & middle incomeLow incomeLower middle incomeLuxembourgMacao SAR, ChinaMacedonia, FYRMadagascarMalawiMalaysiaMaldivesMaliMaltaMauritaniaMauritiusMexicoMiddle East & North AfricaMiddle East & North Africa (excluding high income)Middle East & North Africa (IDA & IBRD countries)Middle incomeMoldovaMongoliaMontenegroMoroccoMozambiqueMyanmarNamibiaNepalNetherlandsNew ZealandNicaraguaNigerNigeriaNorth AmericaNorwayOECD membersOmanOther small statesPakistanPanamaPapua New GuineaParaguayPeruPhilippinesPolandPortugalPost-demographic dividendPre-demographic dividendQatarRomaniaRussian FederationRwandaSamoaSao Tome and PrincipeSaudi ArabiaSenegalSerbiaSeychellesSierra LeoneSingaporeSlovak RepublicSloveniaSmall statesSolomon IslandsSouth AfricaSouth AsiaSouth Asia (IDA & IBRD)South SudanSpainSri LankaSt. Kitts and NevisSt. LuciaSt. Vincent and the GrenadinesSub-Saharan Africa Sub-Saharan Africa (excluding high income)Sub-Saharan Africa (IDA & IBRD countries)SudanSurinameSwazilandSwedenSwitzerlandSyrian Arab RepublicTajikistanTanzaniaThailandTimor-LesteTogoTongaTrinidad and TobagoTunisiaTurkeyUgandaUkraineUnited KingdomUnited StatesUpper middle incomeUruguayVanuatuVenezuela, RBVietnamWorldYemen, Rep.ZambiaZimbabwe Timeline:
This timeline shows a graph from 1974 to 2016 of Kuwait. No data until 1973. Number of actual observations by date: 43.
Source name:
World Development Indicators
Source organization:
International Monetary Fund, International Financial Statistics and data files.
Categories, topics:
Economy & Growth, Financial Sector
Last updated:
apr 23, 2017
Indicators value changes by year
Minimum:
-0.545
jan 1, 1993
Maximum:
12.993
jan 1, 1975
At the date of observation
Value
Absolute change
Change from previous value
jan 1, 1974
8.267
+8.267
0.0%
jan 1, 1975
12.993
+4.726
57.17%
jan 1, 1976
8.392
-4.6
-35.41%
jan 1, 1977
5.235
-3.157
-37.62%
jan 1, 1978
9.89
+4.654
88.91%
jan 1, 1979
8.69
-1.2
-12.13%
jan 1, 1980
7.05
-1.64
-18.87%
jan 1, 1981
6.928
-0.122
-1.73%
jan 1, 1982
7.375
+0.447
6.45%
jan 1, 1983
7.777
+0.402
5.45%
jan 1, 1984
4.718
-3.059
-39.33%
jan 1, 1985
1.177
-3.541
-75.04%
jan 1, 1986
1.49
+0.313
26.57%
jan 1, 1987
0.954
-0.537
-36.01%
jan 1, 1988
0.655
-0.299
-31.33%
jan 1, 1989
1.468
+0.813
124.2%
jan 1, 1990
3.342
+1.874
127.64%
jan 1, 1991
9.834
+6.492
194.24%
jan 1, 1992
9.058
-0.775
-7.89%
jan 1, 1993
-0.545
-9.604
-106.02%
jan 1, 1994
0.383
+0.928
-170.13%
jan 1, 1995
2.534
+2.152
562.53%
jan 1, 1996
2.687
+0.152
6.01%
jan 1, 1997
3.554
+0.867
32.28%
jan 1, 1998
0.682
-2.872
-80.8%
jan 1, 1999
0.13
-0.553
-80.99%
jan 1, 2000
2.991
+2.861
2.21K%
jan 1, 2001
1.813
-1.178
-39.38%
jan 1, 2002
1.3
-0.513
-28.29%
jan 1, 2003
0.888
-0.412
-31.66%
jan 1, 2004
0.961
+0.073
8.21%
jan 1, 2005
1.249
+0.287
29.88%
jan 1, 2006
4.143
+2.894
231.82%
jan 1, 2007
3.057
-1.086
-26.21%
jan 1, 2008
5.485
+2.428
79.42%
jan 1, 2009
10.583
+5.098
92.94%
jan 1, 2010
4.61
-5.973
-56.44%
jan 1, 2011
4.496
-0.113
-2.46%
jan 1, 2012
4.905
+0.409
9.09%
jan 1, 2013
3.199
-1.706
-34.78%
jan 1, 2014
2.703
-0.497
-15.52%
jan 1, 2015
2.909
+0.206
7.63%
jan 1, 2016
3.272
+0.363
12.47%
Ranking of countries by current statistics by years


Comments: