29
/
en
AIzaSyAYiBZKx7MnpbEhh9jyipgxe19OcubqV5w
April 1, 2024
195706
Mexico
MEX
true
2
1
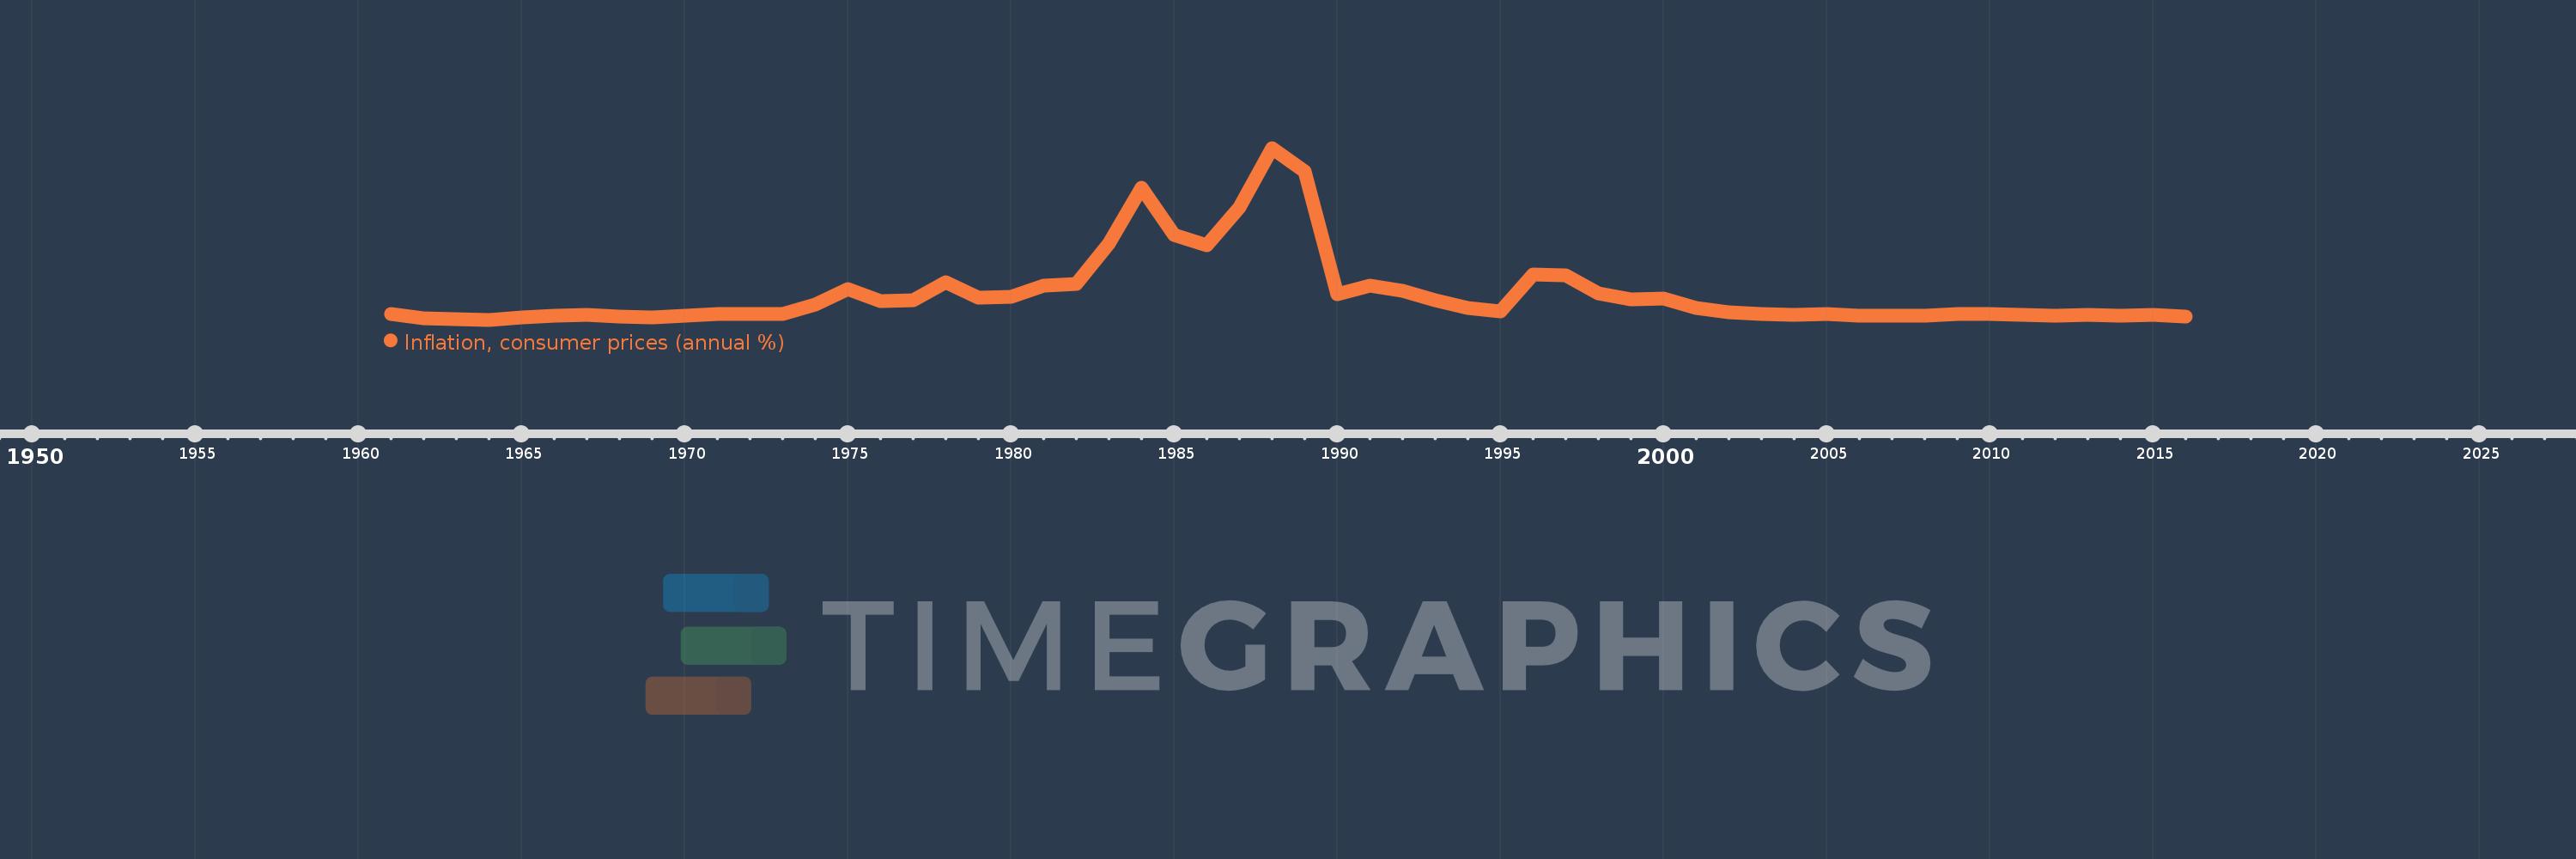
Inflation, consumer prices (annual %)
2016,2015,2014,2013,2012,2011,2010,2009,2008,2007,2006,2005,2004,2003,2002,2001,2000,1999,1998,1997,1996,1995,1994,1993,1992,1991,1990,1989,1988,1987,1986,1985,1984,1983,1982,1981,1980,1979,1978,1977,1976,1975,1974,1973,1972,1971,1970,1969,1968,1967,1966,1965,1964,1963,1962,1961
This statistics in other country:
AfghanistanAlbaniaAlgeriaAngolaAntigua and BarbudaArab WorldArgentinaArmeniaArubaAustraliaAustriaAzerbaijanBahamas, TheBahrainBangladeshBarbadosBelarusBelgiumBelizeBeninBhutanBoliviaBotswanaBrazilBrunei DarussalamBulgariaBurkina FasoBurundiCabo VerdeCambodiaCameroonCanadaCaribbean small statesCentral African RepublicCentral Europe and the BalticsChadChileChinaColombiaComorosCongo, Dem. Rep.Congo, Rep.Costa RicaCote d'IvoireCroatiaCyprusCzech RepublicDenmarkDjiboutiDominicaDominican RepublicEarly-demographic dividendEast Asia & PacificEast Asia & Pacific (excluding high income)East Asia & Pacific (IDA & IBRD countries)EcuadorEgypt, Arab Rep.El SalvadorEquatorial GuineaEstoniaEthiopiaEuro areaEurope & Central AsiaEurope & Central Asia (excluding high income)Europe & Central Asia (IDA & IBRD countries)European UnionFijiFinlandFragile and conflict affected situationsFranceGabonGambia, TheGeorgiaGermanyGhanaGreeceGrenadaGuatemalaGuineaGuinea-BissauGuyanaHaitiHeavily indebted poor countries (HIPC)High incomeHondurasHong Kong SAR, ChinaHungaryIBRD onlyIcelandIDA & IBRD totalIDA blendIDA onlyIDA totalIndiaIndonesiaIran, Islamic Rep.IraqIrelandIsraelItalyJamaicaJapanJordanKazakhstanKenyaKorea, Rep.KuwaitKyrgyz RepublicLao PDRLate-demographic dividendLatin America & Caribbean Latin America & Caribbean (excluding high income)Latin America & the Caribbean (IDA & IBRD countries)LatviaLeast developed countries: UN classificationLebanonLesothoLiberiaLibyaLithuaniaLow & middle incomeLow incomeLower middle incomeLuxembourgMacao SAR, ChinaMacedonia, FYRMadagascarMalawiMalaysiaMaldivesMaliMaltaMauritaniaMauritiusMexicoMiddle East & North AfricaMiddle East & North Africa (excluding high income)Middle East & North Africa (IDA & IBRD countries)Middle incomeMoldovaMongoliaMontenegroMoroccoMozambiqueMyanmarNamibiaNepalNetherlandsNew ZealandNicaraguaNigerNigeriaNorth AmericaNorwayOECD membersOmanOther small statesPakistanPanamaPapua New GuineaParaguayPeruPhilippinesPolandPortugalPost-demographic dividendPre-demographic dividendQatarRomaniaRussian FederationRwandaSamoaSao Tome and PrincipeSaudi ArabiaSenegalSerbiaSeychellesSierra LeoneSingaporeSlovak RepublicSloveniaSmall statesSolomon IslandsSouth AfricaSouth AsiaSouth Asia (IDA & IBRD)South SudanSpainSri LankaSt. Kitts and NevisSt. LuciaSt. Vincent and the GrenadinesSub-Saharan Africa Sub-Saharan Africa (excluding high income)Sub-Saharan Africa (IDA & IBRD countries)SudanSurinameSwazilandSwedenSwitzerlandSyrian Arab RepublicTajikistanTanzaniaThailandTimor-LesteTogoTongaTrinidad and TobagoTunisiaTurkeyUgandaUkraineUnited KingdomUnited StatesUpper middle incomeUruguayVanuatuVenezuela, RBVietnamWorldYemen, Rep.ZambiaZimbabwe Timeline:
This timeline shows a graph from 1961 to 2016 of Mexico. No data until 1960. Number of actual observations by date: 56.
Source name:
World Development Indicators
Source organization:
International Monetary Fund, International Financial Statistics and data files.
Categories, topics:
Economy & Growth, Financial Sector
Last updated:
apr 23, 2017
Indicators value changes by year
Maximum:
131.827
jan 1, 1988
At the date of observation
Value
Absolute change
Change from previous value
jan 1, 1961
4.928
+4.928
0.0%
jan 1, 1962
1.609
-3.319
-67.35%
jan 1, 1963
1.199
-0.41
-25.47%
jan 1, 1964
0.594
-0.605
-50.45%
jan 1, 1965
2.338
+1.744
293.55%
jan 1, 1966
3.568
+1.23
52.62%
jan 1, 1967
4.216
+0.648
18.15%
jan 1, 1968
3.017
-1.199
-28.44%
jan 1, 1969
2.334
-0.683
-22.64%
jan 1, 1970
3.367
+1.033
44.26%
jan 1, 1971
5.212
+1.845
54.79%
jan 1, 1972
5.263
+0.051
0.99%
jan 1, 1973
5.0
-0.263
-5.0%
jan 1, 1974
12.045
+7.045
140.9%
jan 1, 1975
23.75
+11.705
97.18%
jan 1, 1976
15.152
-8.598
-36.2%
jan 1, 1977
15.789
+0.638
4.21%
jan 1, 1978
29.003
+13.213
83.68%
jan 1, 1979
17.461
-11.541
-39.79%
jan 1, 1980
18.173
+0.712
4.08%
jan 1, 1981
26.364
+8.191
45.07%
jan 1, 1982
27.928
+1.564
5.93%
jan 1, 1983
58.924
+30.996
110.99%
jan 1, 1984
101.759
+42.835
72.69%
jan 1, 1985
65.54
-36.219
-35.59%
jan 1, 1986
57.748
-7.791
-11.89%
jan 1, 1987
86.234
+28.486
49.33%
jan 1, 1988
131.827
+45.593
52.87%
jan 1, 1989
114.162
-17.665
-13.4%
jan 1, 1990
20.008
-94.154
-82.47%
jan 1, 1991
26.653
+6.645
33.21%
jan 1, 1992
22.662
-3.991
-14.97%
jan 1, 1993
15.509
-7.153
-31.56%
jan 1, 1994
9.752
-5.757
-37.12%
jan 1, 1995
6.966
-2.786
-28.57%
jan 1, 1996
34.999
+28.033
402.45%
jan 1, 1997
34.378
-0.622
-1.78%
jan 1, 1998
20.626
-13.751
-40.0%
jan 1, 1999
15.928
-4.698
-22.78%
jan 1, 2000
16.586
+0.658
4.13%
jan 1, 2001
9.495
-7.091
-42.75%
jan 1, 2002
6.363
-3.133
-32.99%
jan 1, 2003
5.031
-1.331
-20.93%
jan 1, 2004
4.548
-0.483
-9.6%
jan 1, 2005
4.688
+0.14
3.08%
jan 1, 2006
3.988
-0.7
-14.94%
jan 1, 2007
3.629
-0.359
-8.99%
jan 1, 2008
3.967
+0.337
9.3%
jan 1, 2009
5.125
+1.158
29.2%
jan 1, 2010
5.297
+0.172
3.36%
jan 1, 2011
4.157
-1.141
-21.53%
jan 1, 2012
3.407
-0.749
-18.03%
jan 1, 2013
4.112
+0.704
20.66%
jan 1, 2014
3.806
-0.305
-7.42%
jan 1, 2015
4.019
+0.212
5.58%
jan 1, 2016
2.721
-1.298
-32.3%
Ranking of countries by current statistics by years


Comments: