29
/
en
AIzaSyAYiBZKx7MnpbEhh9jyipgxe19OcubqV5w
April 1, 2024
54882
Post-demographic dividend
PST
false
2
1
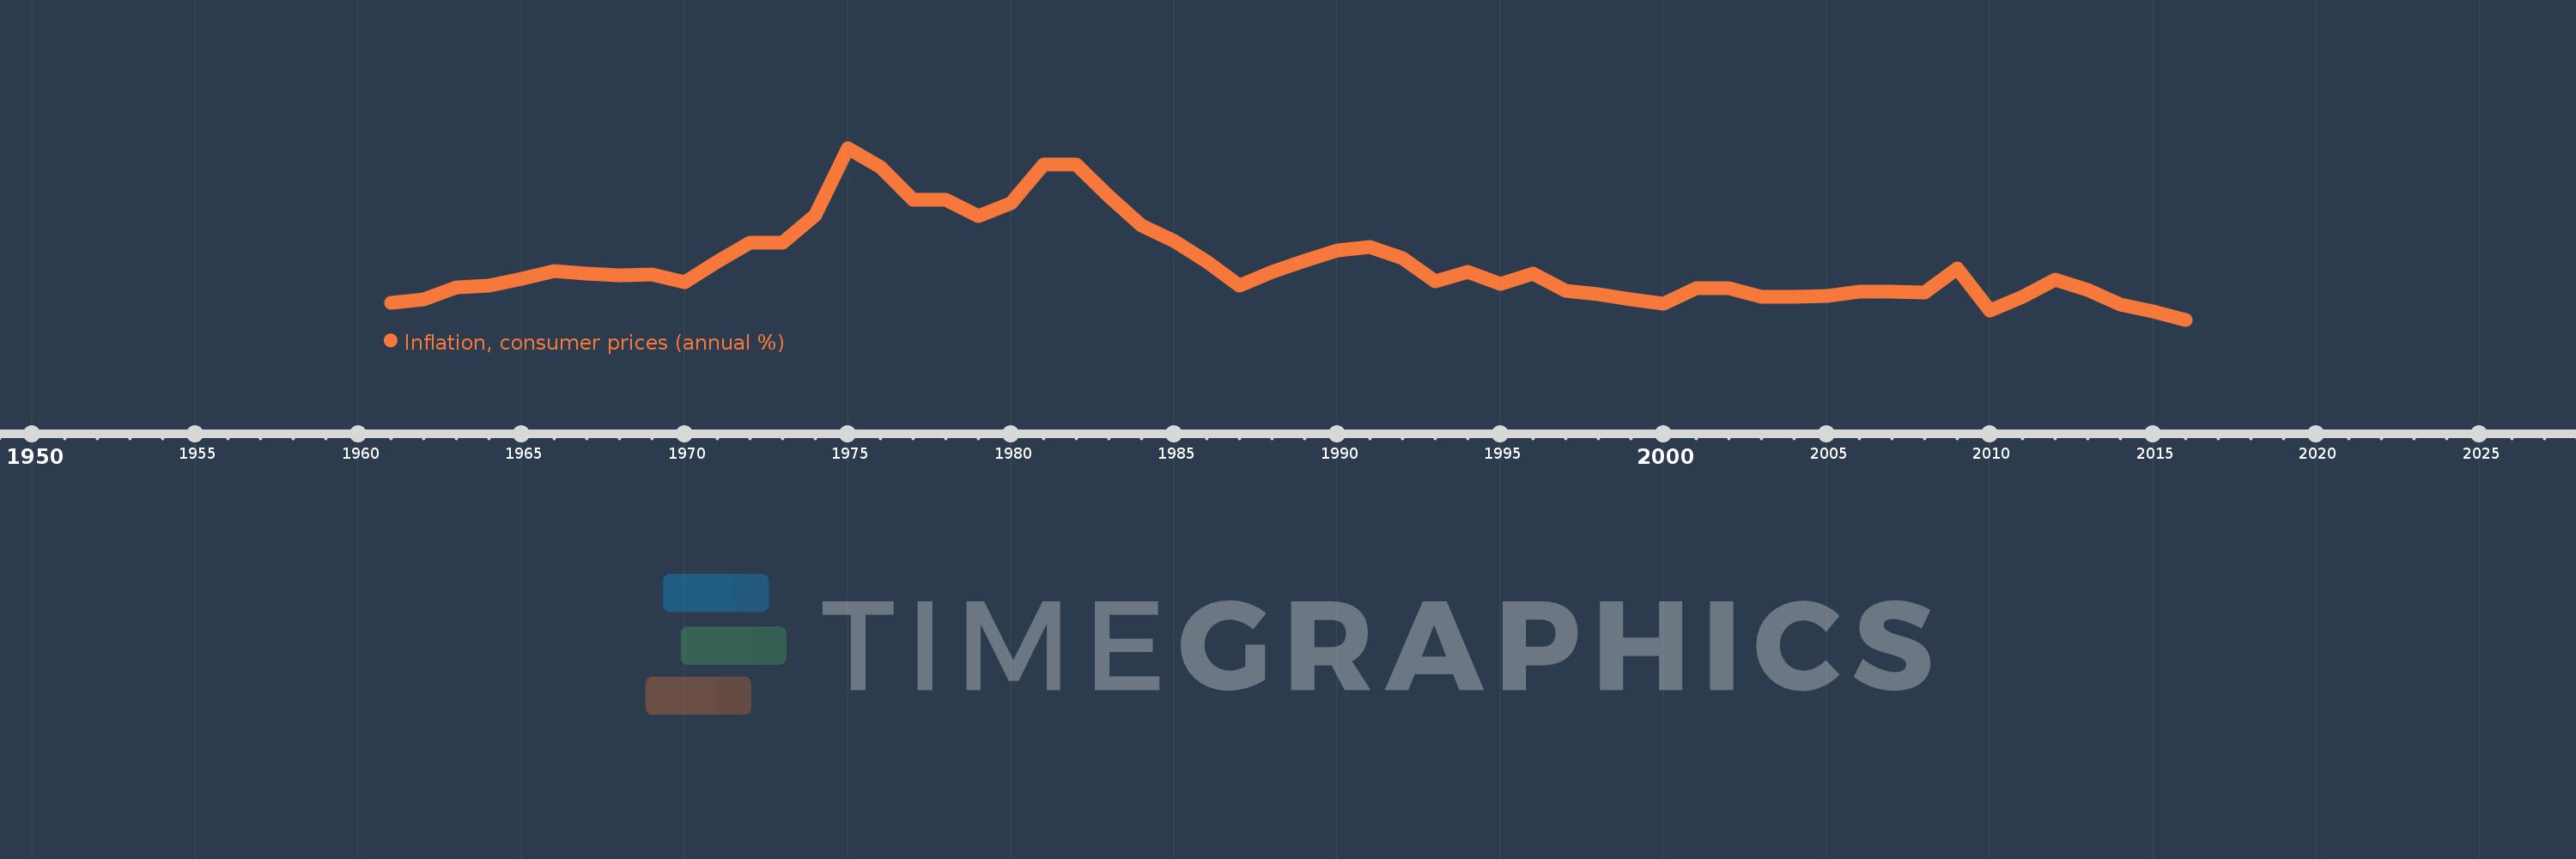
Inflation, consumer prices (annual %)
2016,2015,2014,2013,2012,2011,2010,2009,2008,2007,2006,2005,2004,2003,2002,2001,2000,1999,1998,1997,1996,1995,1994,1993,1992,1991,1990,1989,1988,1987,1986,1985,1984,1983,1982,1981,1980,1979,1978,1977,1976,1975,1974,1973,1972,1971,1970,1969,1968,1967,1966,1965,1964,1963,1962,1961
This statistics in other country:
AfghanistanAlbaniaAlgeriaAngolaAntigua and BarbudaArab WorldArgentinaArmeniaArubaAustraliaAustriaAzerbaijanBahamas, TheBahrainBangladeshBarbadosBelarusBelgiumBelizeBeninBhutanBoliviaBotswanaBrazilBrunei DarussalamBulgariaBurkina FasoBurundiCabo VerdeCambodiaCameroonCanadaCaribbean small statesCentral African RepublicCentral Europe and the BalticsChadChileChinaColombiaComorosCongo, Dem. Rep.Congo, Rep.Costa RicaCote d'IvoireCroatiaCyprusCzech RepublicDenmarkDjiboutiDominicaDominican RepublicEarly-demographic dividendEast Asia & PacificEast Asia & Pacific (excluding high income)East Asia & Pacific (IDA & IBRD countries)EcuadorEgypt, Arab Rep.El SalvadorEquatorial GuineaEstoniaEthiopiaEuro areaEurope & Central AsiaEurope & Central Asia (excluding high income)Europe & Central Asia (IDA & IBRD countries)European UnionFijiFinlandFragile and conflict affected situationsFranceGabonGambia, TheGeorgiaGermanyGhanaGreeceGrenadaGuatemalaGuineaGuinea-BissauGuyanaHaitiHeavily indebted poor countries (HIPC)High incomeHondurasHong Kong SAR, ChinaHungaryIBRD onlyIcelandIDA & IBRD totalIDA blendIDA onlyIDA totalIndiaIndonesiaIran, Islamic Rep.IraqIrelandIsraelItalyJamaicaJapanJordanKazakhstanKenyaKorea, Rep.KuwaitKyrgyz RepublicLao PDRLate-demographic dividendLatin America & Caribbean Latin America & Caribbean (excluding high income)Latin America & the Caribbean (IDA & IBRD countries)LatviaLeast developed countries: UN classificationLebanonLesothoLiberiaLibyaLithuaniaLow & middle incomeLow incomeLower middle incomeLuxembourgMacao SAR, ChinaMacedonia, FYRMadagascarMalawiMalaysiaMaldivesMaliMaltaMauritaniaMauritiusMexicoMiddle East & North AfricaMiddle East & North Africa (excluding high income)Middle East & North Africa (IDA & IBRD countries)Middle incomeMoldovaMongoliaMontenegroMoroccoMozambiqueMyanmarNamibiaNepalNetherlandsNew ZealandNicaraguaNigerNigeriaNorth AmericaNorwayOECD membersOmanOther small statesPakistanPanamaPapua New GuineaParaguayPeruPhilippinesPolandPortugalPost-demographic dividendPre-demographic dividendQatarRomaniaRussian FederationRwandaSamoaSao Tome and PrincipeSaudi ArabiaSenegalSerbiaSeychellesSierra LeoneSingaporeSlovak RepublicSloveniaSmall statesSolomon IslandsSouth AfricaSouth AsiaSouth Asia (IDA & IBRD)South SudanSpainSri LankaSt. Kitts and NevisSt. LuciaSt. Vincent and the GrenadinesSub-Saharan Africa Sub-Saharan Africa (excluding high income)Sub-Saharan Africa (IDA & IBRD countries)SudanSurinameSwazilandSwedenSwitzerlandSyrian Arab RepublicTajikistanTanzaniaThailandTimor-LesteTogoTongaTrinidad and TobagoTunisiaTurkeyUgandaUkraineUnited KingdomUnited StatesUpper middle incomeUruguayVanuatuVenezuela, RBVietnamWorldYemen, Rep.ZambiaZimbabwe Timeline:
This timeline shows a graph from 1961 to 2016 of Post-demographic dividend. No data until 1960. Number of actual observations by date: 56.
Source name:
World Development Indicators
Source organization:
International Monetary Fund, International Financial Statistics and data files.
Categories, topics:
Economy & Growth, Financial Sector
Last updated:
apr 23, 2017
Indicators value changes by year
Maximum:
13.164
jan 1, 1975
At the date of observation
Value
Absolute change
Change from previous value
jan 1, 1961
1.55
+1.55
0.0%
jan 1, 1962
1.845
+0.296
19.08%
jan 1, 1963
2.696
+0.851
46.1%
jan 1, 1964
2.871
+0.175
6.48%
jan 1, 1965
3.389
+0.518
18.04%
jan 1, 1966
3.962
+0.573
16.92%
jan 1, 1967
3.737
-0.225
-5.67%
jan 1, 1968
3.635
-0.103
-2.74%
jan 1, 1969
3.676
+0.041
1.12%
jan 1, 1970
3.08
-0.595
-16.19%
jan 1, 1971
4.639
+1.558
50.58%
jan 1, 1972
6.064
+1.425
30.73%
jan 1, 1973
6.063
-0.001
-0.02%
jan 1, 1974
8.123
+2.06
33.98%
jan 1, 1975
13.164
+5.04
62.05%
jan 1, 1976
11.697
-1.467
-11.15%
jan 1, 1977
9.284
-2.413
-20.63%
jan 1, 1978
9.269
-0.015
-0.16%
jan 1, 1979
8.038
-1.231
-13.28%
jan 1, 1980
9.033
+0.996
12.39%
jan 1, 1981
11.95
+2.917
32.29%
jan 1, 1982
11.9
-0.05
-0.42%
jan 1, 1983
9.567
-2.333
-19.61%
jan 1, 1984
7.356
-2.211
-23.11%
jan 1, 1985
6.201
-1.154
-15.69%
jan 1, 1986
4.652
-1.549
-24.98%
jan 1, 1987
2.825
-1.827
-39.28%
jan 1, 1988
3.863
+1.038
36.74%
jan 1, 1989
4.695
+0.832
21.55%
jan 1, 1990
5.469
+0.773
16.47%
jan 1, 1991
5.749
+0.28
5.12%
jan 1, 1992
4.925
-0.824
-14.33%
jan 1, 1993
3.184
-1.742
-35.36%
jan 1, 1994
3.885
+0.702
22.04%
jan 1, 1995
2.959
-0.926
-23.84%
jan 1, 1996
3.755
+0.796
26.9%
jan 1, 1997
2.481
-1.274
-33.93%
jan 1, 1998
2.176
-0.305
-12.29%
jan 1, 1999
1.834
-0.343
-15.74%
jan 1, 2000
1.513
-0.321
-17.5%
jan 1, 2001
2.632
+1.119
73.99%
jan 1, 2002
2.665
+0.033
1.27%
jan 1, 2003
1.995
-0.67
-25.13%
jan 1, 2004
2.022
+0.026
1.31%
jan 1, 2005
2.077
+0.055
2.72%
jan 1, 2006
2.391
+0.315
15.15%
jan 1, 2007
2.398
+0.007
0.29%
jan 1, 2008
2.327
-0.071
-2.98%
jan 1, 2009
4.114
+1.788
76.83%
jan 1, 2010
0.95
-3.164
-76.9%
jan 1, 2011
2.015
+1.065
112.04%
jan 1, 2012
3.317
+1.302
64.6%
jan 1, 2013
2.542
-0.775
-23.36%
jan 1, 2014
1.422
-1.12
-44.07%
jan 1, 2015
0.907
-0.515
-36.22%
jan 1, 2016
0.29
-0.617
-68.06%
Ranking of countries by current statistics by years


Comments: