29
/
en
AIzaSyAYiBZKx7MnpbEhh9jyipgxe19OcubqV5w
April 1, 2024
219717
Papua New Guinea
PNG
true
2
1
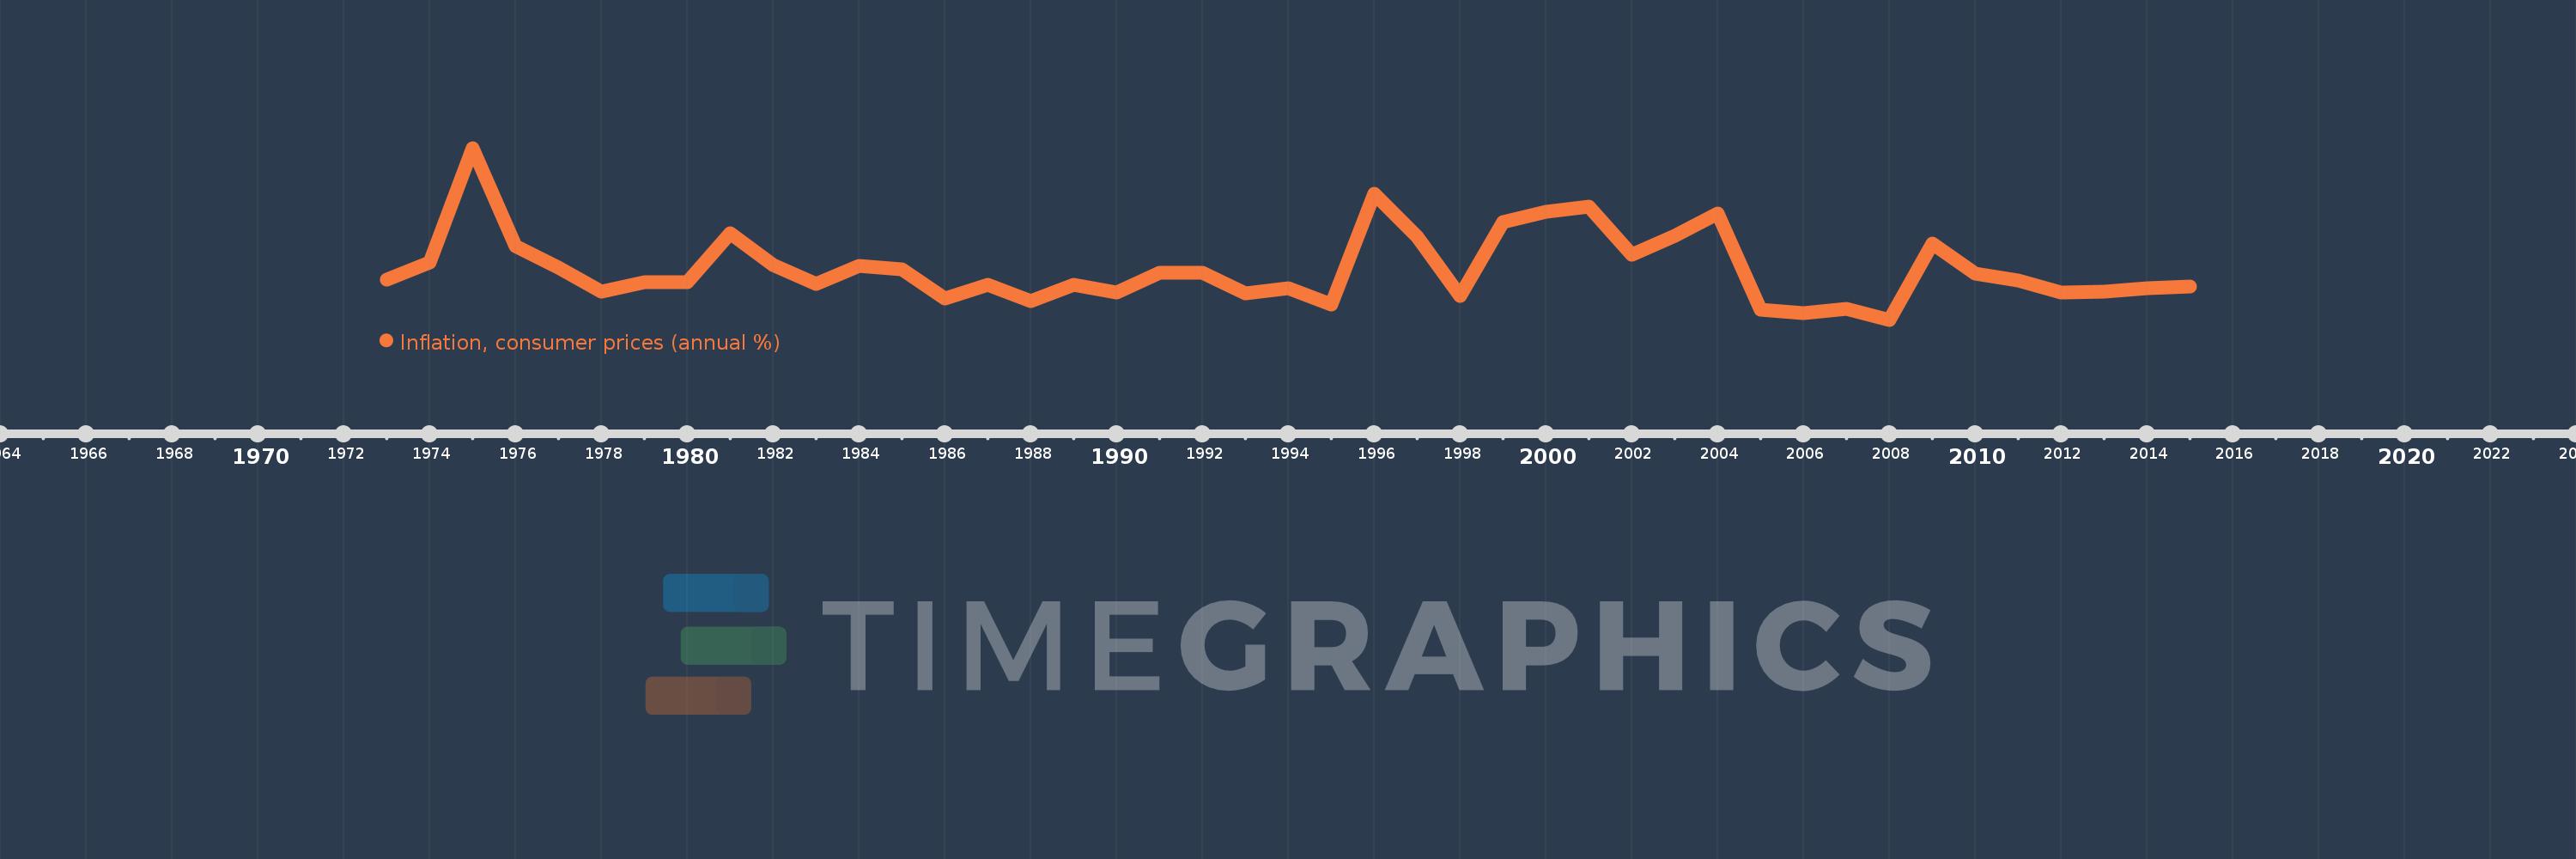
Inflation, consumer prices (annual %)
2015,2014,2013,2012,2011,2010,2009,2008,2007,2006,2005,2004,2003,2002,2001,2000,1999,1998,1997,1996,1995,1994,1993,1992,1991,1990,1989,1988,1987,1986,1985,1984,1983,1982,1981,1980,1979,1978,1977,1976,1975,1974,1973
This statistics in other country:
AfghanistanAlbaniaAlgeriaAngolaAntigua and BarbudaArab WorldArgentinaArmeniaArubaAustraliaAustriaAzerbaijanBahamas, TheBahrainBangladeshBarbadosBelarusBelgiumBelizeBeninBhutanBoliviaBotswanaBrazilBrunei DarussalamBulgariaBurkina FasoBurundiCabo VerdeCambodiaCameroonCanadaCaribbean small statesCentral African RepublicCentral Europe and the BalticsChadChileChinaColombiaComorosCongo, Dem. Rep.Congo, Rep.Costa RicaCote d'IvoireCroatiaCyprusCzech RepublicDenmarkDjiboutiDominicaDominican RepublicEarly-demographic dividendEast Asia & PacificEast Asia & Pacific (excluding high income)East Asia & Pacific (IDA & IBRD countries)EcuadorEgypt, Arab Rep.El SalvadorEquatorial GuineaEstoniaEthiopiaEuro areaEurope & Central AsiaEurope & Central Asia (excluding high income)Europe & Central Asia (IDA & IBRD countries)European UnionFijiFinlandFragile and conflict affected situationsFranceGabonGambia, TheGeorgiaGermanyGhanaGreeceGrenadaGuatemalaGuineaGuinea-BissauGuyanaHaitiHeavily indebted poor countries (HIPC)High incomeHondurasHong Kong SAR, ChinaHungaryIBRD onlyIcelandIDA & IBRD totalIDA blendIDA onlyIDA totalIndiaIndonesiaIran, Islamic Rep.IraqIrelandIsraelItalyJamaicaJapanJordanKazakhstanKenyaKorea, Rep.KuwaitKyrgyz RepublicLao PDRLate-demographic dividendLatin America & Caribbean Latin America & Caribbean (excluding high income)Latin America & the Caribbean (IDA & IBRD countries)LatviaLeast developed countries: UN classificationLebanonLesothoLiberiaLibyaLithuaniaLow & middle incomeLow incomeLower middle incomeLuxembourgMacao SAR, ChinaMacedonia, FYRMadagascarMalawiMalaysiaMaldivesMaliMaltaMauritaniaMauritiusMexicoMiddle East & North AfricaMiddle East & North Africa (excluding high income)Middle East & North Africa (IDA & IBRD countries)Middle incomeMoldovaMongoliaMontenegroMoroccoMozambiqueMyanmarNamibiaNepalNetherlandsNew ZealandNicaraguaNigerNigeriaNorth AmericaNorwayOECD membersOmanOther small statesPakistanPanamaPapua New GuineaParaguayPeruPhilippinesPolandPortugalPost-demographic dividendPre-demographic dividendQatarRomaniaRussian FederationRwandaSamoaSao Tome and PrincipeSaudi ArabiaSenegalSerbiaSeychellesSierra LeoneSingaporeSlovak RepublicSloveniaSmall statesSolomon IslandsSouth AfricaSouth AsiaSouth Asia (IDA & IBRD)South SudanSpainSri LankaSt. Kitts and NevisSt. LuciaSt. Vincent and the GrenadinesSub-Saharan Africa Sub-Saharan Africa (excluding high income)Sub-Saharan Africa (IDA & IBRD countries)SudanSurinameSwazilandSwedenSwitzerlandSyrian Arab RepublicTajikistanTanzaniaThailandTimor-LesteTogoTongaTrinidad and TobagoTunisiaTurkeyUgandaUkraineUnited KingdomUnited StatesUpper middle incomeUruguayVanuatuVenezuela, RBVietnamWorldYemen, Rep.ZambiaZimbabwe Timeline:
This timeline shows a graph from 1973 to 2015 of Papua New Guinea. No data until 1972. Number of actual observations by date: 43.
Source name:
World Development Indicators
Source organization:
International Monetary Fund, International Financial Statistics and data files.
Categories, topics:
Economy & Growth, Financial Sector
Last updated:
apr 23, 2017
Indicators value changes by year
Maximum:
23.167
jan 1, 1975
At the date of observation
Value
Absolute change
Change from previous value
jan 1, 1973
6.075
+6.075
0.0%
jan 1, 1974
8.343
+2.268
37.34%
jan 1, 1975
23.167
+14.824
177.68%
jan 1, 1976
10.491
-12.676
-54.72%
jan 1, 1977
7.657
-2.834
-27.02%
jan 1, 1978
4.529
-3.128
-40.85%
jan 1, 1979
5.8
+1.271
28.08%
jan 1, 1980
5.766
-0.034
-0.59%
jan 1, 1981
12.064
+6.299
109.25%
jan 1, 1982
8.054
-4.01
-33.24%
jan 1, 1983
5.535
-2.519
-31.28%
jan 1, 1984
7.902
+2.367
42.76%
jan 1, 1985
7.421
-0.481
-6.09%
jan 1, 1986
3.71
-3.71
-50.0%
jan 1, 1987
5.454
+1.743
46.99%
jan 1, 1988
3.337
-2.116
-38.8%
jan 1, 1989
5.445
+2.108
63.15%
jan 1, 1990
4.48
-0.965
-17.72%
jan 1, 1991
6.953
+2.473
55.19%
jan 1, 1992
6.966
+0.012
0.18%
jan 1, 1993
4.31
-2.656
-38.13%
jan 1, 1994
4.974
+0.664
15.42%
jan 1, 1995
2.853
-2.121
-42.65%
jan 1, 1996
17.281
+14.428
505.77%
jan 1, 1997
11.624
-5.657
-32.73%
jan 1, 1998
3.964
-7.66
-65.9%
jan 1, 1999
13.574
+9.61
242.4%
jan 1, 2000
14.932
+1.358
10.0%
jan 1, 2001
15.596
+0.664
4.44%
jan 1, 2002
9.298
-6.298
-40.38%
jan 1, 2003
11.799
+2.501
26.9%
jan 1, 2004
14.709
+2.91
24.66%
jan 1, 2005
2.159
-12.55
-85.32%
jan 1, 2006
1.781
-0.378
-17.51%
jan 1, 2007
2.368
+0.588
33.0%
jan 1, 2008
0.911
-1.457
-61.52%
jan 1, 2009
10.761
+9.85
1.08K%
jan 1, 2010
6.918
-3.843
-35.71%
jan 1, 2011
6.014
-0.905
-13.08%
jan 1, 2012
4.441
-1.573
-26.15%
jan 1, 2013
4.537
+0.096
2.17%
jan 1, 2014
4.96
+0.423
9.33%
jan 1, 2015
5.208
+0.248
4.99%
Ranking of countries by current statistics by years


Comments: