29
/
en
AIzaSyAYiBZKx7MnpbEhh9jyipgxe19OcubqV5w
April 1, 2024
272397
Uganda
UGA
true
2
1
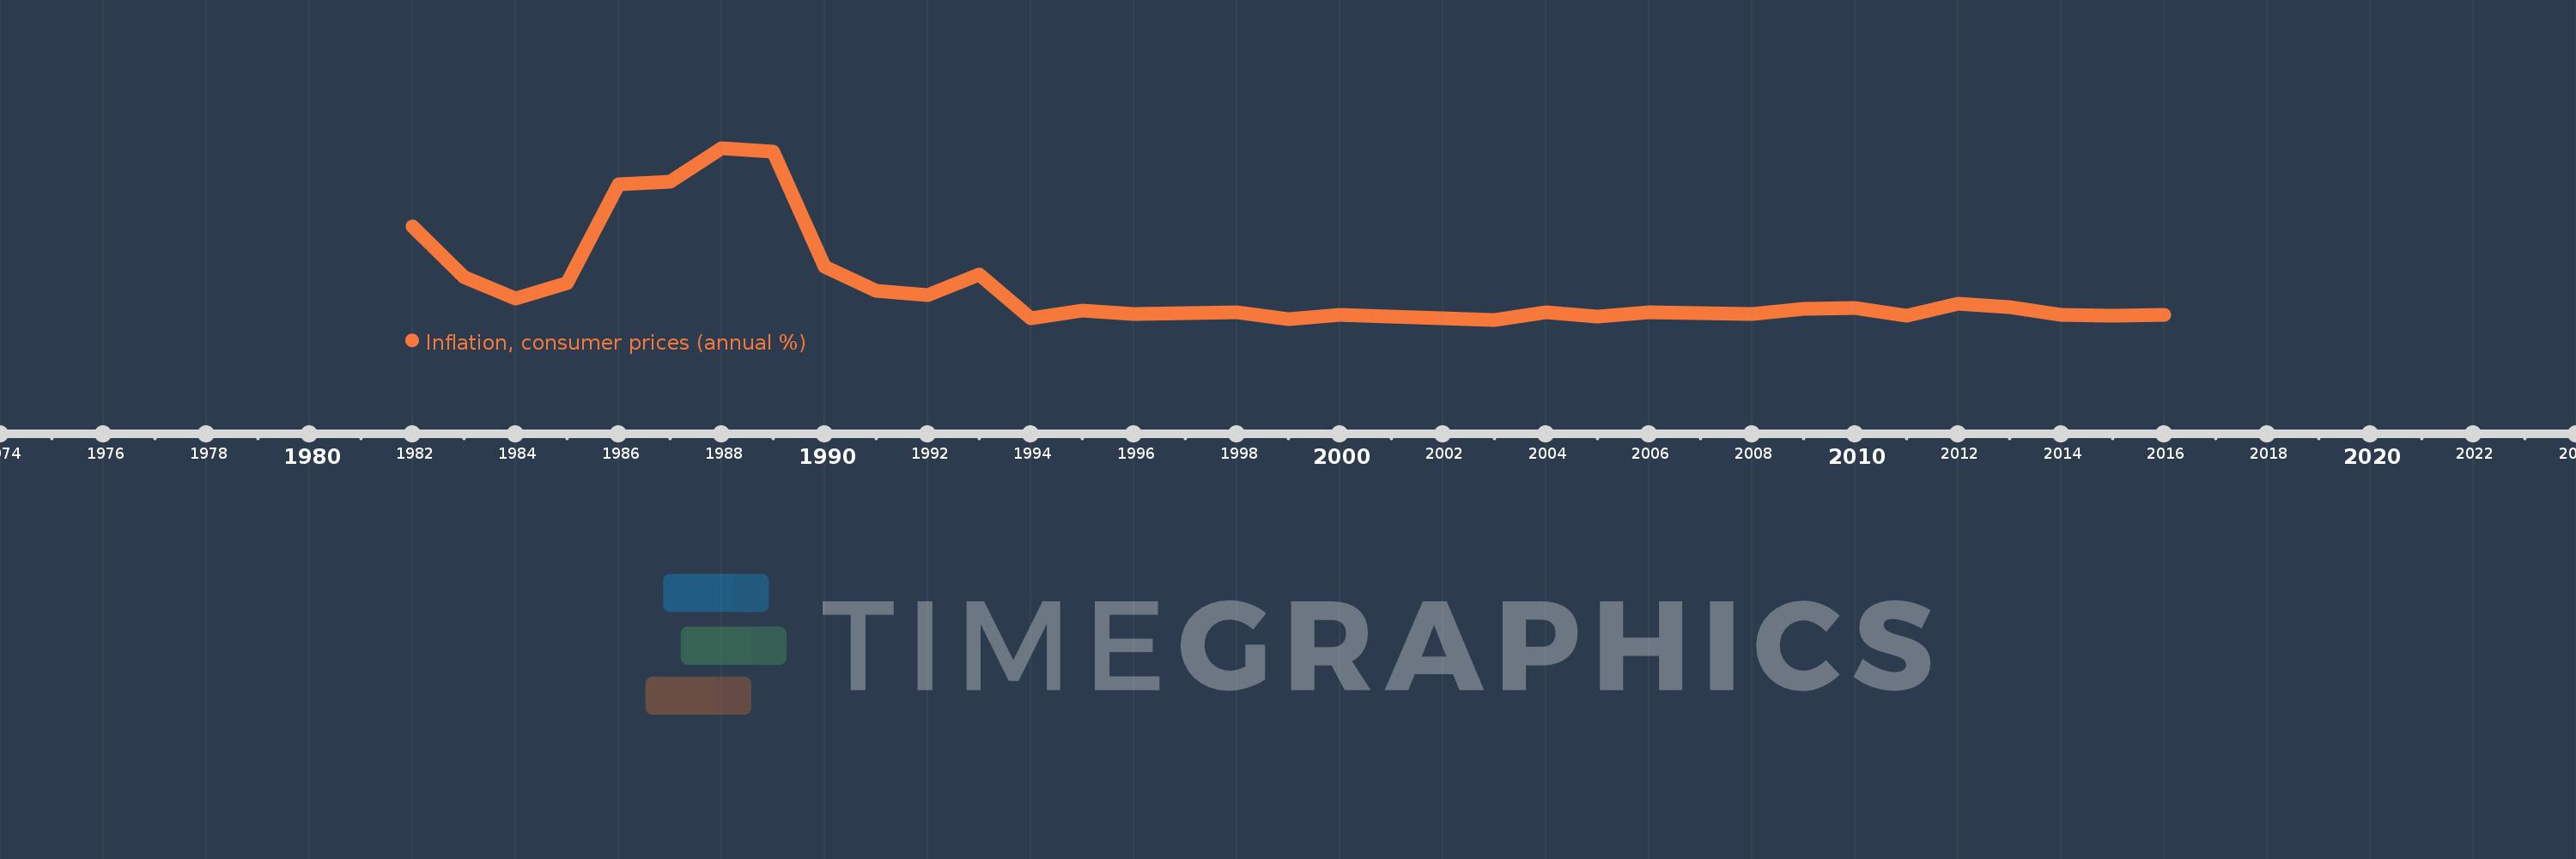
Inflation, consumer prices (annual %)
2016,2015,2014,2013,2012,2011,2010,2009,2008,2007,2006,2005,2004,2003,2002,2001,2000,1999,1998,1997,1996,1995,1994,1993,1992,1991,1990,1989,1988,1987,1986,1985,1984,1983,1982
This statistics in other country:
AfghanistanAlbaniaAlgeriaAngolaAntigua and BarbudaArab WorldArgentinaArmeniaArubaAustraliaAustriaAzerbaijanBahamas, TheBahrainBangladeshBarbadosBelarusBelgiumBelizeBeninBhutanBoliviaBotswanaBrazilBrunei DarussalamBulgariaBurkina FasoBurundiCabo VerdeCambodiaCameroonCanadaCaribbean small statesCentral African RepublicCentral Europe and the BalticsChadChileChinaColombiaComorosCongo, Dem. Rep.Congo, Rep.Costa RicaCote d'IvoireCroatiaCyprusCzech RepublicDenmarkDjiboutiDominicaDominican RepublicEarly-demographic dividendEast Asia & PacificEast Asia & Pacific (excluding high income)East Asia & Pacific (IDA & IBRD countries)EcuadorEgypt, Arab Rep.El SalvadorEquatorial GuineaEstoniaEthiopiaEuro areaEurope & Central AsiaEurope & Central Asia (excluding high income)Europe & Central Asia (IDA & IBRD countries)European UnionFijiFinlandFragile and conflict affected situationsFranceGabonGambia, TheGeorgiaGermanyGhanaGreeceGrenadaGuatemalaGuineaGuinea-BissauGuyanaHaitiHeavily indebted poor countries (HIPC)High incomeHondurasHong Kong SAR, ChinaHungaryIBRD onlyIcelandIDA & IBRD totalIDA blendIDA onlyIDA totalIndiaIndonesiaIran, Islamic Rep.IraqIrelandIsraelItalyJamaicaJapanJordanKazakhstanKenyaKorea, Rep.KuwaitKyrgyz RepublicLao PDRLate-demographic dividendLatin America & Caribbean Latin America & Caribbean (excluding high income)Latin America & the Caribbean (IDA & IBRD countries)LatviaLeast developed countries: UN classificationLebanonLesothoLiberiaLibyaLithuaniaLow & middle incomeLow incomeLower middle incomeLuxembourgMacao SAR, ChinaMacedonia, FYRMadagascarMalawiMalaysiaMaldivesMaliMaltaMauritaniaMauritiusMexicoMiddle East & North AfricaMiddle East & North Africa (excluding high income)Middle East & North Africa (IDA & IBRD countries)Middle incomeMoldovaMongoliaMontenegroMoroccoMozambiqueMyanmarNamibiaNepalNetherlandsNew ZealandNicaraguaNigerNigeriaNorth AmericaNorwayOECD membersOmanOther small statesPakistanPanamaPapua New GuineaParaguayPeruPhilippinesPolandPortugalPost-demographic dividendPre-demographic dividendQatarRomaniaRussian FederationRwandaSamoaSao Tome and PrincipeSaudi ArabiaSenegalSerbiaSeychellesSierra LeoneSingaporeSlovak RepublicSloveniaSmall statesSolomon IslandsSouth AfricaSouth AsiaSouth Asia (IDA & IBRD)South SudanSpainSri LankaSt. Kitts and NevisSt. LuciaSt. Vincent and the GrenadinesSub-Saharan Africa Sub-Saharan Africa (excluding high income)Sub-Saharan Africa (IDA & IBRD countries)SudanSurinameSwazilandSwedenSwitzerlandSyrian Arab RepublicTajikistanTanzaniaThailandTimor-LesteTogoTongaTrinidad and TobagoTunisiaTurkeyUgandaUkraineUnited KingdomUnited StatesUpper middle incomeUruguayVanuatuVenezuela, RBVietnamWorldYemen, Rep.ZambiaZimbabwe Timeline:
This timeline shows a graph from 1982 to 2016 of Uganda. No data until 1981. Number of actual observations by date: 35.
Source name:
World Development Indicators
Source organization:
International Monetary Fund, International Financial Statistics and data files.
Categories, topics:
Economy & Growth, Financial Sector
Last updated:
apr 23, 2017
Indicators value changes by year
Minimum:
-0.288
jan 1, 2003
Maximum:
200.026
jan 1, 1988
At the date of observation
Value
Absolute change
Change from previous value
jan 1, 1982
108.74
+108.74
0.0%
jan 1, 1983
49.274
-59.466
-54.69%
jan 1, 1984
24.053
-25.221
-51.18%
jan 1, 1985
42.726
+18.672
77.63%
jan 1, 1986
157.655
+114.93
268.99%
jan 1, 1987
160.985
+3.329
2.11%
jan 1, 1988
200.026
+39.041
24.25%
jan 1, 1989
196.119
-3.907
-1.95%
jan 1, 1990
61.441
-134.678
-68.67%
jan 1, 1991
33.119
-28.322
-46.1%
jan 1, 1992
28.068
-5.051
-15.25%
jan 1, 1993
52.442
+24.374
86.84%
jan 1, 1994
1.164
-51.278
-97.78%
jan 1, 1995
10.037
+8.873
762.28%
jan 1, 1996
6.55
-3.487
-34.74%
jan 1, 1997
7.192
+0.642
9.79%
jan 1, 1998
8.169
+0.977
13.59%
jan 1, 1999
0.069
-8.1
-99.16%
jan 1, 2000
5.777
+5.709
8.3K%
jan 1, 2001
3.392
-2.385
-41.29%
jan 1, 2002
1.865
-1.527
-45.01%
jan 1, 2003
-0.288
-2.153
-115.41%
jan 1, 2004
8.68
+8.968
-3.12K%
jan 1, 2005
3.721
-4.959
-57.13%
jan 1, 2006
8.449
+4.727
127.04%
jan 1, 2007
7.311
-1.138
-13.47%
jan 1, 2008
6.139
-1.172
-16.03%
jan 1, 2009
12.051
+5.912
96.32%
jan 1, 2010
13.017
+0.966
8.02%
jan 1, 2011
3.977
-9.041
-69.45%
jan 1, 2012
18.693
+14.716
370.08%
jan 1, 2013
14.016
-4.677
-25.02%
jan 1, 2014
5.464
-8.552
-61.01%
jan 1, 2015
4.288
-1.176
-21.52%
jan 1, 2016
5.225
+0.937
21.86%
Ranking of countries by current statistics by years


Comments: