29
/
en
AIzaSyAYiBZKx7MnpbEhh9jyipgxe19OcubqV5w
April 1, 2024
256480
Sweden
SWE
true
2
1
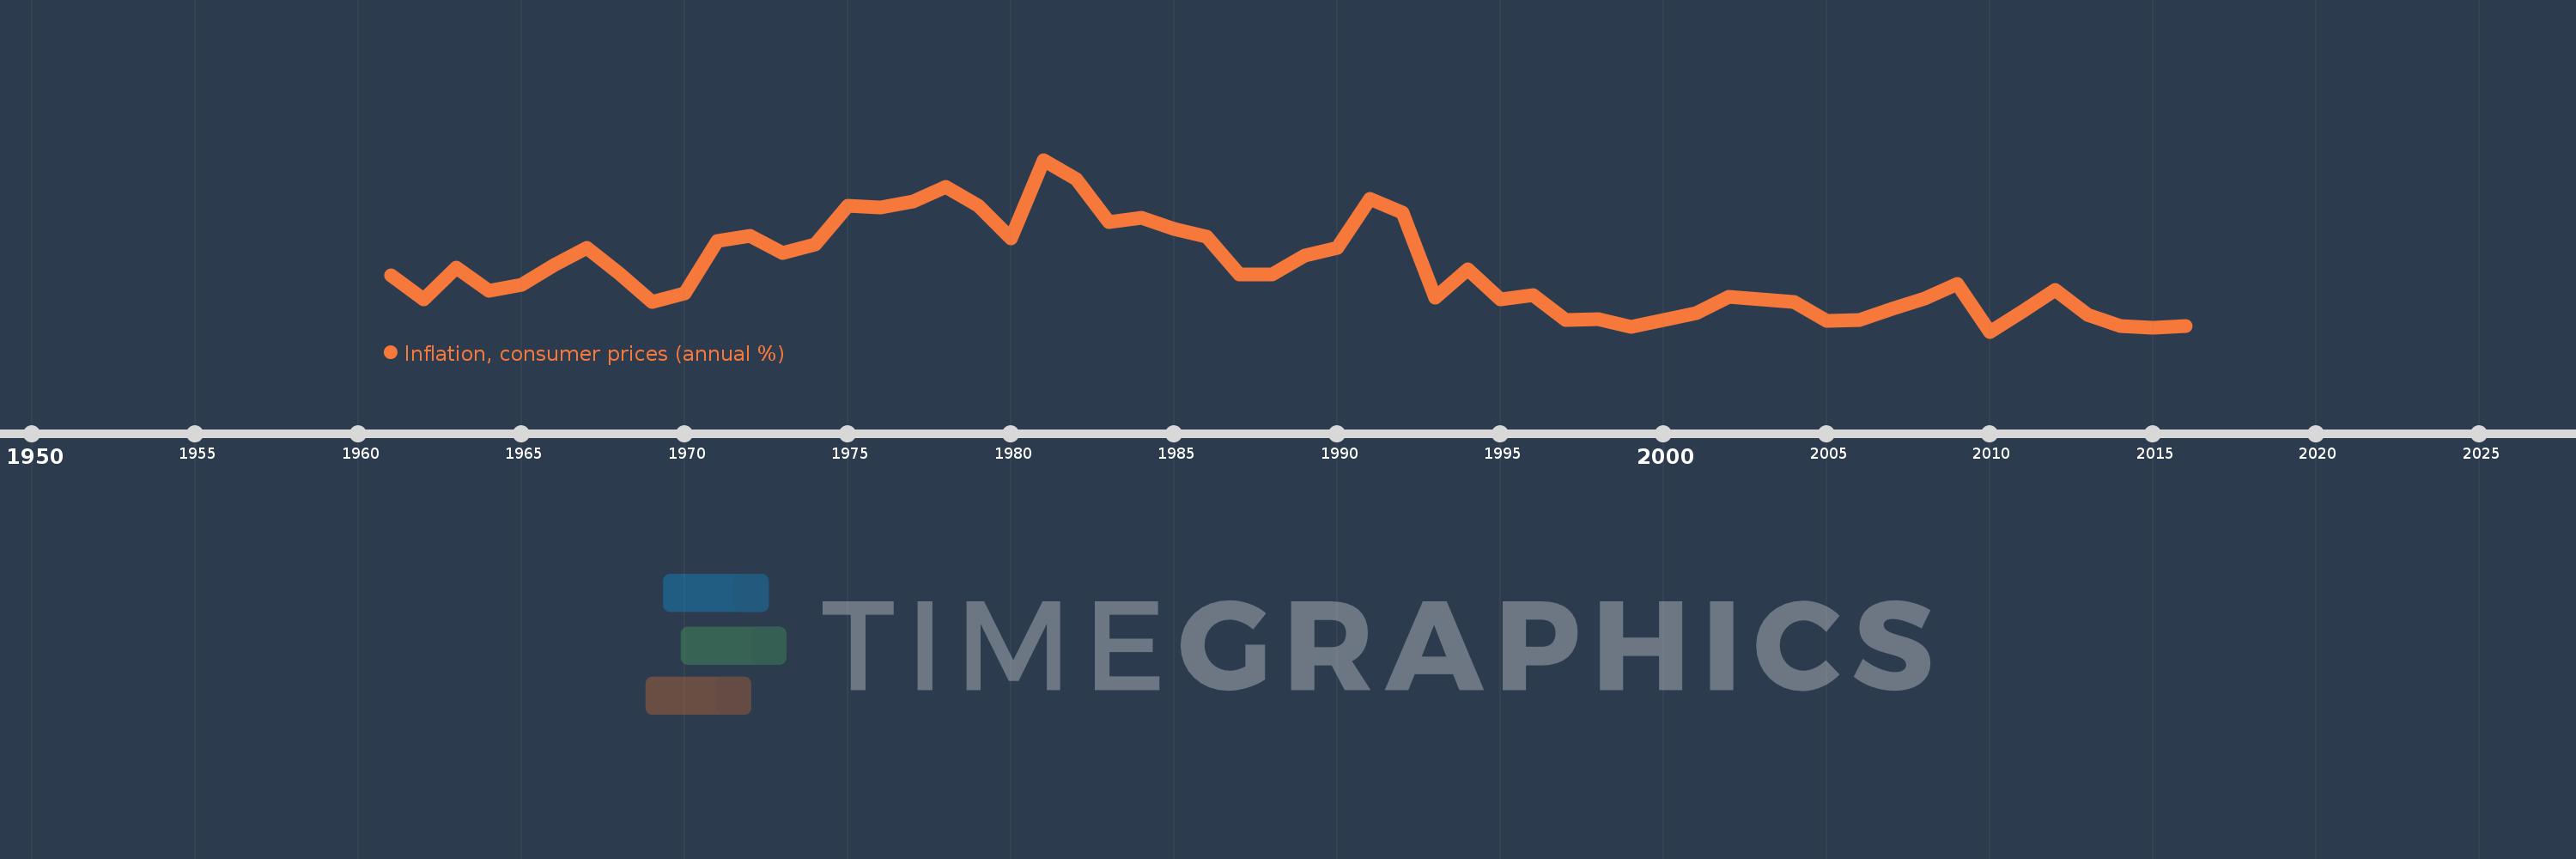
Inflation, consumer prices (annual %)
2016,2015,2014,2013,2012,2011,2010,2009,2008,2007,2006,2005,2004,2003,2002,2001,2000,1999,1998,1997,1996,1995,1994,1993,1992,1991,1990,1989,1988,1987,1986,1985,1984,1983,1982,1981,1980,1979,1978,1977,1976,1975,1974,1973,1972,1971,1970,1969,1968,1967,1966,1965,1964,1963,1962,1961
This statistics in other country:
AfghanistanAlbaniaAlgeriaAngolaAntigua and BarbudaArab WorldArgentinaArmeniaArubaAustraliaAustriaAzerbaijanBahamas, TheBahrainBangladeshBarbadosBelarusBelgiumBelizeBeninBhutanBoliviaBotswanaBrazilBrunei DarussalamBulgariaBurkina FasoBurundiCabo VerdeCambodiaCameroonCanadaCaribbean small statesCentral African RepublicCentral Europe and the BalticsChadChileChinaColombiaComorosCongo, Dem. Rep.Congo, Rep.Costa RicaCote d'IvoireCroatiaCyprusCzech RepublicDenmarkDjiboutiDominicaDominican RepublicEarly-demographic dividendEast Asia & PacificEast Asia & Pacific (excluding high income)East Asia & Pacific (IDA & IBRD countries)EcuadorEgypt, Arab Rep.El SalvadorEquatorial GuineaEstoniaEthiopiaEuro areaEurope & Central AsiaEurope & Central Asia (excluding high income)Europe & Central Asia (IDA & IBRD countries)European UnionFijiFinlandFragile and conflict affected situationsFranceGabonGambia, TheGeorgiaGermanyGhanaGreeceGrenadaGuatemalaGuineaGuinea-BissauGuyanaHaitiHeavily indebted poor countries (HIPC)High incomeHondurasHong Kong SAR, ChinaHungaryIBRD onlyIcelandIDA & IBRD totalIDA blendIDA onlyIDA totalIndiaIndonesiaIran, Islamic Rep.IraqIrelandIsraelItalyJamaicaJapanJordanKazakhstanKenyaKorea, Rep.KuwaitKyrgyz RepublicLao PDRLate-demographic dividendLatin America & Caribbean Latin America & Caribbean (excluding high income)Latin America & the Caribbean (IDA & IBRD countries)LatviaLeast developed countries: UN classificationLebanonLesothoLiberiaLibyaLithuaniaLow & middle incomeLow incomeLower middle incomeLuxembourgMacao SAR, ChinaMacedonia, FYRMadagascarMalawiMalaysiaMaldivesMaliMaltaMauritaniaMauritiusMexicoMiddle East & North AfricaMiddle East & North Africa (excluding high income)Middle East & North Africa (IDA & IBRD countries)Middle incomeMoldovaMongoliaMontenegroMoroccoMozambiqueMyanmarNamibiaNepalNetherlandsNew ZealandNicaraguaNigerNigeriaNorth AmericaNorwayOECD membersOmanOther small statesPakistanPanamaPapua New GuineaParaguayPeruPhilippinesPolandPortugalPost-demographic dividendPre-demographic dividendQatarRomaniaRussian FederationRwandaSamoaSao Tome and PrincipeSaudi ArabiaSenegalSerbiaSeychellesSierra LeoneSingaporeSlovak RepublicSloveniaSmall statesSolomon IslandsSouth AfricaSouth AsiaSouth Asia (IDA & IBRD)South SudanSpainSri LankaSt. Kitts and NevisSt. LuciaSt. Vincent and the GrenadinesSub-Saharan Africa Sub-Saharan Africa (excluding high income)Sub-Saharan Africa (IDA & IBRD countries)SudanSurinameSwazilandSwedenSwitzerlandSyrian Arab RepublicTajikistanTanzaniaThailandTimor-LesteTogoTongaTrinidad and TobagoTunisiaTurkeyUgandaUkraineUnited KingdomUnited StatesUpper middle incomeUruguayVanuatuVenezuela, RBVietnamWorldYemen, Rep.ZambiaZimbabwe Timeline:
This timeline shows a graph from 1961 to 2016 of Sweden. No data until 1960. Number of actual observations by date: 56.
Source name:
World Development Indicators
Source organization:
International Monetary Fund, International Financial Statistics and data files.
Categories, topics:
Economy & Growth, Financial Sector
Last updated:
apr 23, 2017
Indicators value changes by year
Minimum:
-0.494
jan 1, 2010
Maximum:
13.704
jan 1, 1981
At the date of observation
Value
Absolute change
Change from previous value
jan 1, 1961
4.142
+4.142
0.0%
jan 1, 1962
2.158
-1.984
-47.9%
jan 1, 1963
4.766
+2.608
120.86%
jan 1, 1964
2.871
-1.895
-39.77%
jan 1, 1965
3.389
+0.518
18.04%
jan 1, 1966
5.013
+1.624
47.93%
jan 1, 1967
6.405
+1.392
27.77%
jan 1, 1968
4.289
-2.115
-33.03%
jan 1, 1969
1.943
-2.346
-54.7%
jan 1, 1970
2.692
+0.749
38.54%
jan 1, 1971
7.016
+4.324
160.64%
jan 1, 1972
7.396
+0.379
5.4%
jan 1, 1973
6.007
-1.388
-18.77%
jan 1, 1974
6.718
+0.711
11.83%
jan 1, 1975
9.912
+3.194
47.54%
jan 1, 1976
9.78
-0.132
-1.33%
jan 1, 1977
10.279
+0.499
5.1%
jan 1, 1978
11.488
+1.209
11.77%
jan 1, 1979
9.92
-1.568
-13.65%
jan 1, 1980
7.21
-2.711
-27.32%
jan 1, 1981
13.704
+6.494
90.07%
jan 1, 1982
12.108
-1.595
-11.64%
jan 1, 1983
8.578
-3.53
-29.16%
jan 1, 1984
8.907
+0.329
3.83%
jan 1, 1985
8.021
-0.886
-9.94%
jan 1, 1986
7.367
-0.654
-8.15%
jan 1, 1987
4.233
-3.134
-42.54%
jan 1, 1988
4.222
-0.011
-0.25%
jan 1, 1989
5.798
+1.575
37.31%
jan 1, 1990
6.437
+0.64
11.03%
jan 1, 1991
10.47
+4.032
62.64%
jan 1, 1992
9.337
-1.133
-10.82%
jan 1, 1993
2.282
-7.055
-75.56%
jan 1, 1994
4.648
+2.366
103.71%
jan 1, 1995
2.2
-2.448
-52.66%
jan 1, 1996
2.528
+0.328
14.92%
jan 1, 1997
0.471
-2.057
-81.37%
jan 1, 1998
0.518
+0.047
9.9%
jan 1, 1999
-0.136
-0.654
-126.28%
jan 1, 2000
0.454
+0.59
-433.79%
jan 1, 2001
1.037
+0.583
128.46%
jan 1, 2002
2.406
+1.369
131.95%
jan 1, 2003
2.158
-0.247
-10.29%
jan 1, 2004
1.926
-0.233
-10.79%
jan 1, 2005
0.374
-1.552
-80.6%
jan 1, 2006
0.453
+0.08
21.28%
jan 1, 2007
1.36
+0.907
200.15%
jan 1, 2008
2.212
+0.852
62.63%
jan 1, 2009
3.437
+1.225
55.37%
jan 1, 2010
-0.494
-3.932
-114.39%
jan 1, 2011
1.158
+1.652
-334.19%
jan 1, 2012
2.961
+1.803
155.72%
jan 1, 2013
0.888
-2.073
-70.0%
jan 1, 2014
-0.044
-0.933
-104.99%
jan 1, 2015
-0.18
-0.135
305.57%
jan 1, 2016
-0.047
+0.133
-73.96%
Ranking of countries by current statistics by years


Comments: