29
/
en
AIzaSyAYiBZKx7MnpbEhh9jyipgxe19OcubqV5w
April 1, 2024
51954
North America
NAC
false
2
1
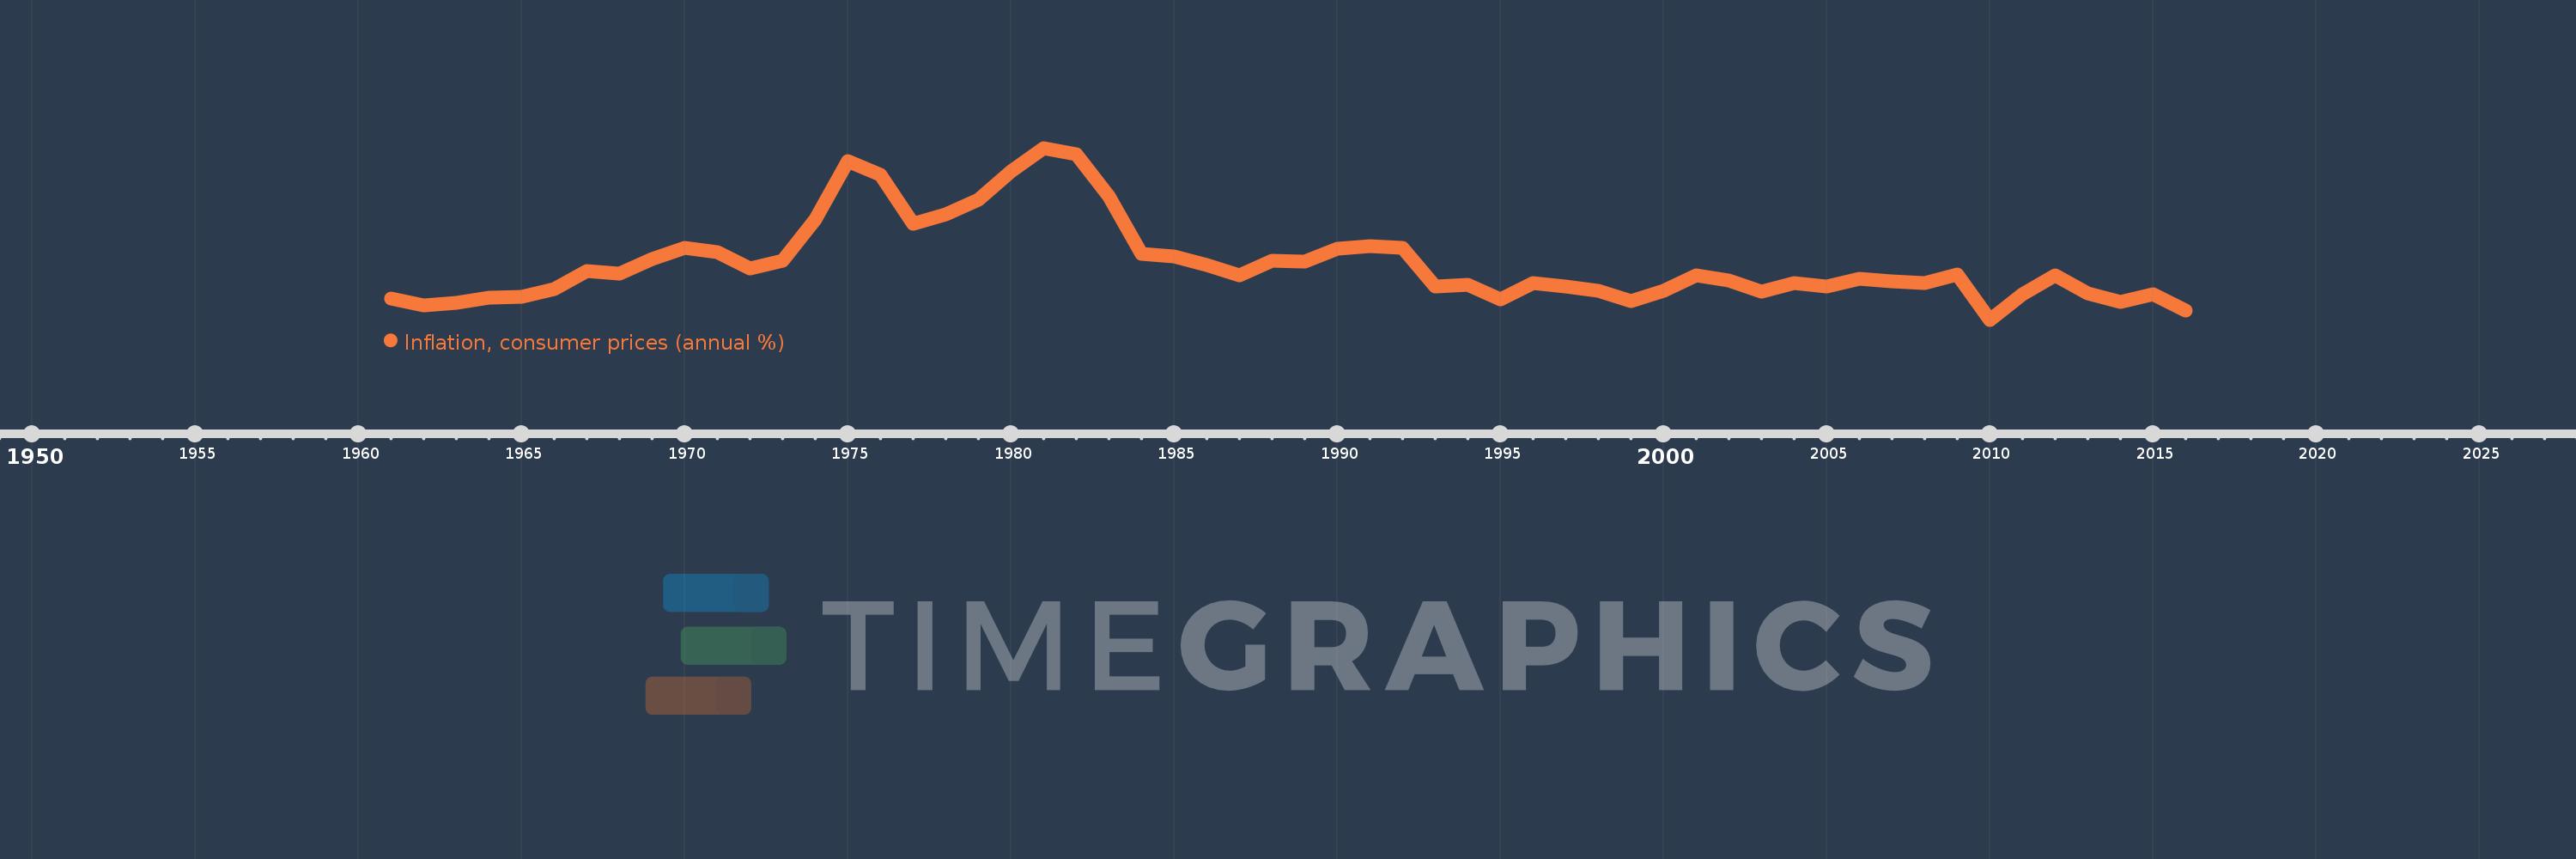
Inflation, consumer prices (annual %)
2016,2015,2014,2013,2012,2011,2010,2009,2008,2007,2006,2005,2004,2003,2002,2001,2000,1999,1998,1997,1996,1995,1994,1993,1992,1991,1990,1989,1988,1987,1986,1985,1984,1983,1982,1981,1980,1979,1978,1977,1976,1975,1974,1973,1972,1971,1970,1969,1968,1967,1966,1965,1964,1963,1962,1961
This statistics in other country:
AfghanistanAlbaniaAlgeriaAngolaAntigua and BarbudaArab WorldArgentinaArmeniaArubaAustraliaAustriaAzerbaijanBahamas, TheBahrainBangladeshBarbadosBelarusBelgiumBelizeBeninBhutanBoliviaBotswanaBrazilBrunei DarussalamBulgariaBurkina FasoBurundiCabo VerdeCambodiaCameroonCanadaCaribbean small statesCentral African RepublicCentral Europe and the BalticsChadChileChinaColombiaComorosCongo, Dem. Rep.Congo, Rep.Costa RicaCote d'IvoireCroatiaCyprusCzech RepublicDenmarkDjiboutiDominicaDominican RepublicEarly-demographic dividendEast Asia & PacificEast Asia & Pacific (excluding high income)East Asia & Pacific (IDA & IBRD countries)EcuadorEgypt, Arab Rep.El SalvadorEquatorial GuineaEstoniaEthiopiaEuro areaEurope & Central AsiaEurope & Central Asia (excluding high income)Europe & Central Asia (IDA & IBRD countries)European UnionFijiFinlandFragile and conflict affected situationsFranceGabonGambia, TheGeorgiaGermanyGhanaGreeceGrenadaGuatemalaGuineaGuinea-BissauGuyanaHaitiHeavily indebted poor countries (HIPC)High incomeHondurasHong Kong SAR, ChinaHungaryIBRD onlyIcelandIDA & IBRD totalIDA blendIDA onlyIDA totalIndiaIndonesiaIran, Islamic Rep.IraqIrelandIsraelItalyJamaicaJapanJordanKazakhstanKenyaKorea, Rep.KuwaitKyrgyz RepublicLao PDRLate-demographic dividendLatin America & Caribbean Latin America & Caribbean (excluding high income)Latin America & the Caribbean (IDA & IBRD countries)LatviaLeast developed countries: UN classificationLebanonLesothoLiberiaLibyaLithuaniaLow & middle incomeLow incomeLower middle incomeLuxembourgMacao SAR, ChinaMacedonia, FYRMadagascarMalawiMalaysiaMaldivesMaliMaltaMauritaniaMauritiusMexicoMiddle East & North AfricaMiddle East & North Africa (excluding high income)Middle East & North Africa (IDA & IBRD countries)Middle incomeMoldovaMongoliaMontenegroMoroccoMozambiqueMyanmarNamibiaNepalNetherlandsNew ZealandNicaraguaNigerNigeriaNorth AmericaNorwayOECD membersOmanOther small statesPakistanPanamaPapua New GuineaParaguayPeruPhilippinesPolandPortugalPost-demographic dividendPre-demographic dividendQatarRomaniaRussian FederationRwandaSamoaSao Tome and PrincipeSaudi ArabiaSenegalSerbiaSeychellesSierra LeoneSingaporeSlovak RepublicSloveniaSmall statesSolomon IslandsSouth AfricaSouth AsiaSouth Asia (IDA & IBRD)South SudanSpainSri LankaSt. Kitts and NevisSt. LuciaSt. Vincent and the GrenadinesSub-Saharan Africa Sub-Saharan Africa (excluding high income)Sub-Saharan Africa (IDA & IBRD countries)SudanSurinameSwazilandSwedenSwitzerlandSyrian Arab RepublicTajikistanTanzaniaThailandTimor-LesteTogoTongaTrinidad and TobagoTunisiaTurkeyUgandaUkraineUnited KingdomUnited StatesUpper middle incomeUruguayVanuatuVenezuela, RBVietnamWorldYemen, Rep.ZambiaZimbabwe Timeline:
This timeline shows a graph from 1961 to 2016 of North America. No data until 1960. Number of actual observations by date: 56.
Source name:
World Development Indicators
Source organization:
International Monetary Fund, International Financial Statistics and data files.
Categories, topics:
Economy & Growth, Financial Sector
Last updated:
apr 23, 2017
Indicators value changes by year
Minimum:
-0.028
jan 1, 2010
Maximum:
11.846
jan 1, 1981
At the date of observation
Value
Absolute change
Change from previous value
jan 1, 1961
1.411
+1.411
0.0%
jan 1, 1962
0.971
-0.44
-31.21%
jan 1, 1963
1.147
+0.177
18.21%
jan 1, 1964
1.492
+0.344
30.01%
jan 1, 1965
1.551
+0.059
3.95%
jan 1, 1966
2.065
+0.514
33.16%
jan 1, 1967
3.364
+1.299
62.94%
jan 1, 1968
3.174
-0.19
-5.65%
jan 1, 1969
4.152
+0.977
30.79%
jan 1, 1970
4.962
+0.81
19.51%
jan 1, 1971
4.631
-0.331
-6.67%
jan 1, 1972
3.546
-1.084
-23.42%
jan 1, 1973
4.04
+0.494
13.93%
jan 1, 1974
6.916
+2.875
71.17%
jan 1, 1975
10.95
+4.034
58.33%
jan 1, 1976
9.973
-0.977
-8.93%
jan 1, 1977
6.623
-3.35
-33.59%
jan 1, 1978
7.239
+0.616
9.3%
jan 1, 1979
8.28
+1.041
14.39%
jan 1, 1980
10.205
+1.925
23.25%
jan 1, 1981
11.846
+1.641
16.08%
jan 1, 1982
11.389
-0.457
-3.86%
jan 1, 1983
8.482
-2.907
-25.52%
jan 1, 1984
4.514
-3.968
-46.78%
jan 1, 1985
4.328
-0.186
-4.13%
jan 1, 1986
3.756
-0.572
-13.22%
jan 1, 1987
3.016
-0.74
-19.69%
jan 1, 1988
4.053
+1.037
34.36%
jan 1, 1989
4.016
-0.037
-0.91%
jan 1, 1990
4.911
+0.895
22.29%
jan 1, 1991
5.081
+0.17
3.47%
jan 1, 1992
4.925
-0.156
-3.07%
jan 1, 1993
2.267
-2.658
-53.96%
jan 1, 1994
2.397
+0.129
5.7%
jan 1, 1995
1.396
-1.0
-41.73%
jan 1, 1996
2.487
+1.09
78.09%
jan 1, 1997
2.251
-0.236
-9.49%
jan 1, 1998
1.979
-0.271
-12.06%
jan 1, 1999
1.274
-0.705
-35.63%
jan 1, 2000
1.961
+0.687
53.95%
jan 1, 2001
3.048
+1.087
55.4%
jan 1, 2002
2.676
-0.373
-12.22%
jan 1, 2003
1.922
-0.753
-28.16%
jan 1, 2004
2.514
+0.592
30.8%
jan 1, 2005
2.267
-0.247
-9.83%
jan 1, 2006
2.803
+0.536
23.64%
jan 1, 2007
2.614
-0.189
-6.75%
jan 1, 2008
2.496
-0.118
-4.53%
jan 1, 2009
3.105
+0.609
24.41%
jan 1, 2010
-0.028
-3.133
-100.9%
jan 1, 2011
1.708
+1.736
-6.19K%
jan 1, 2012
3.034
+1.326
77.62%
jan 1, 2013
1.793
-1.242
-40.93%
jan 1, 2014
1.202
-0.591
-32.97%
jan 1, 2015
1.764
+0.563
46.84%
jan 1, 2016
0.622
-1.142
-64.75%
Ranking of countries by current statistics by years


Comments: