29
/
en
AIzaSyAYiBZKx7MnpbEhh9jyipgxe19OcubqV5w
April 1, 2024
150530
Honduras
HND
true
2
1
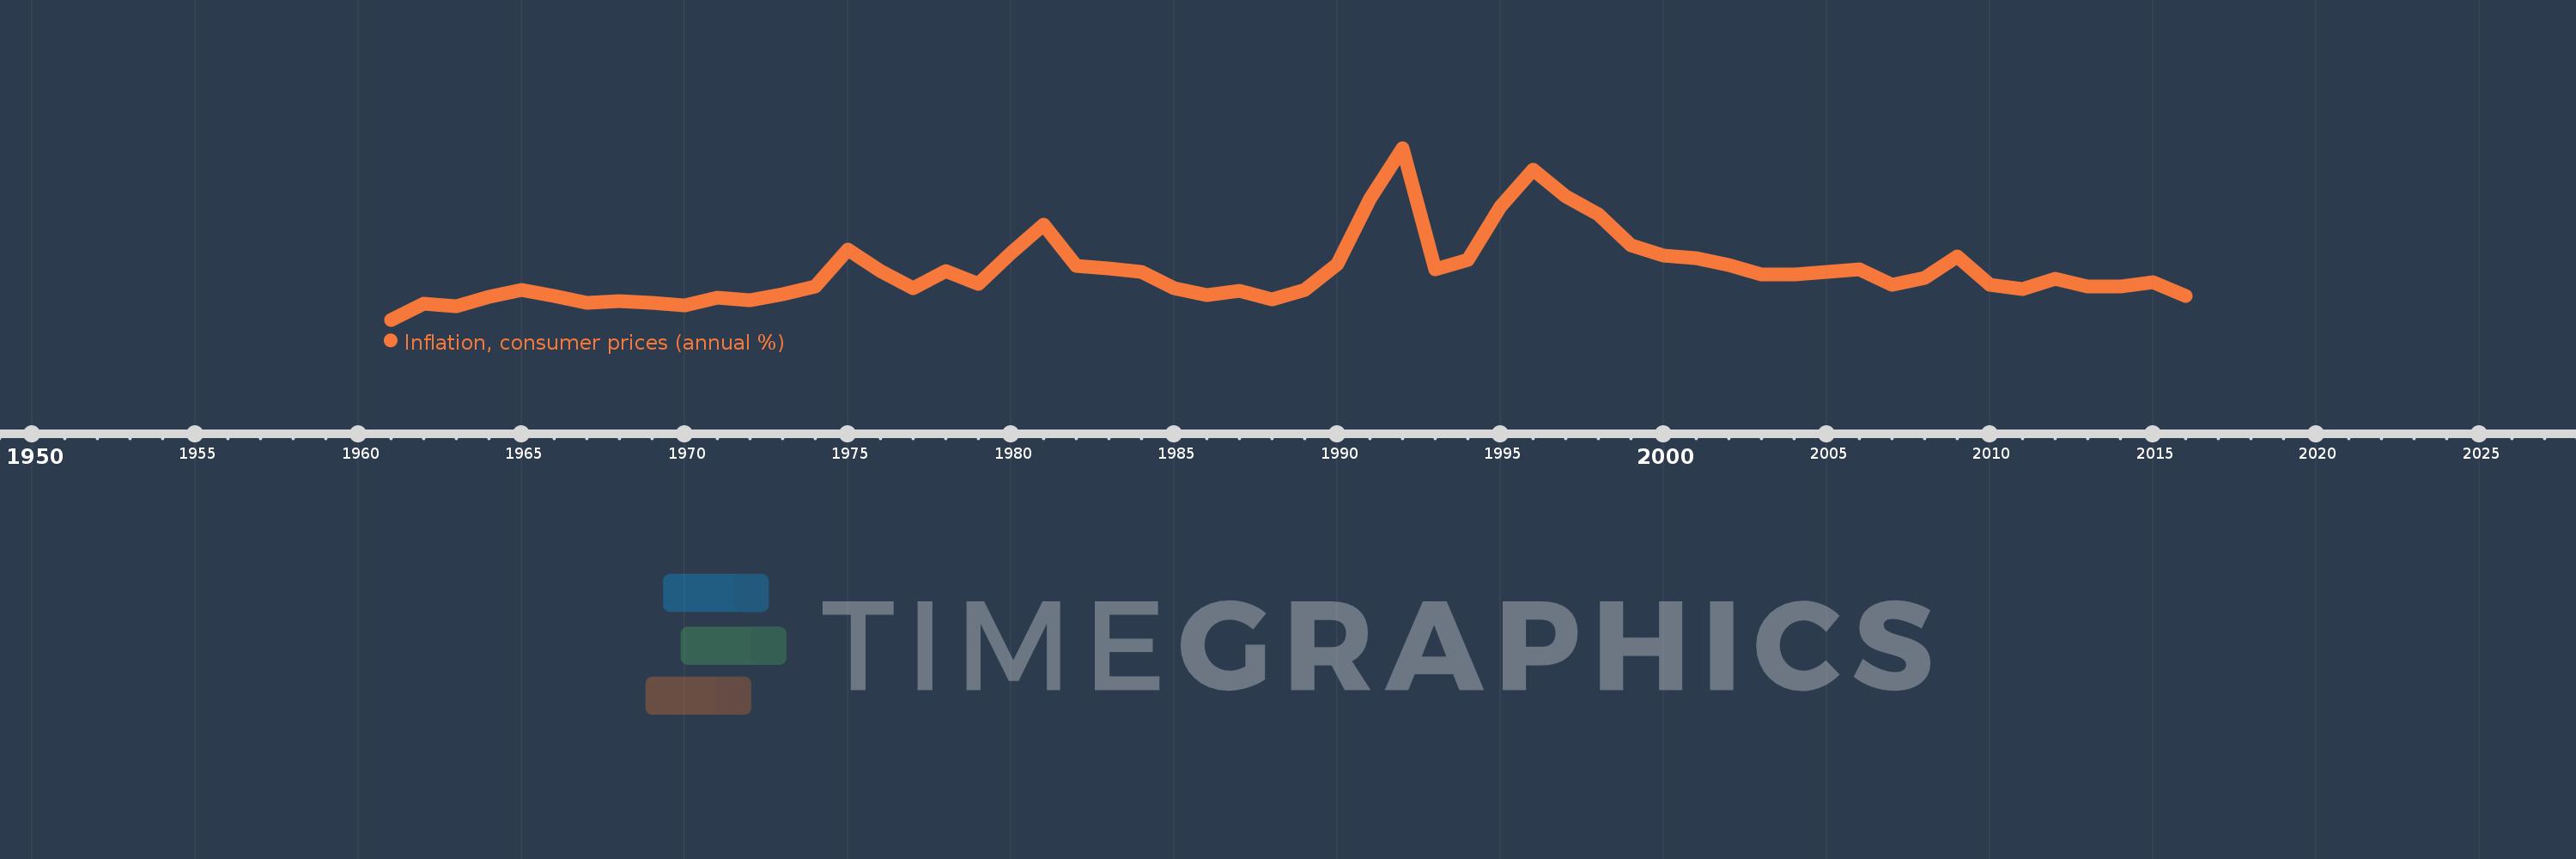
Inflation, consumer prices (annual %)
2016,2015,2014,2013,2012,2011,2010,2009,2008,2007,2006,2005,2004,2003,2002,2001,2000,1999,1998,1997,1996,1995,1994,1993,1992,1991,1990,1989,1988,1987,1986,1985,1984,1983,1982,1981,1980,1979,1978,1977,1976,1975,1974,1973,1972,1971,1970,1969,1968,1967,1966,1965,1964,1963,1962,1961
This statistics in other country:
AfghanistanAlbaniaAlgeriaAngolaAntigua and BarbudaArab WorldArgentinaArmeniaArubaAustraliaAustriaAzerbaijanBahamas, TheBahrainBangladeshBarbadosBelarusBelgiumBelizeBeninBhutanBoliviaBotswanaBrazilBrunei DarussalamBulgariaBurkina FasoBurundiCabo VerdeCambodiaCameroonCanadaCaribbean small statesCentral African RepublicCentral Europe and the BalticsChadChileChinaColombiaComorosCongo, Dem. Rep.Congo, Rep.Costa RicaCote d'IvoireCroatiaCyprusCzech RepublicDenmarkDjiboutiDominicaDominican RepublicEarly-demographic dividendEast Asia & PacificEast Asia & Pacific (excluding high income)East Asia & Pacific (IDA & IBRD countries)EcuadorEgypt, Arab Rep.El SalvadorEquatorial GuineaEstoniaEthiopiaEuro areaEurope & Central AsiaEurope & Central Asia (excluding high income)Europe & Central Asia (IDA & IBRD countries)European UnionFijiFinlandFragile and conflict affected situationsFranceGabonGambia, TheGeorgiaGermanyGhanaGreeceGrenadaGuatemalaGuineaGuinea-BissauGuyanaHaitiHeavily indebted poor countries (HIPC)High incomeHondurasHong Kong SAR, ChinaHungaryIBRD onlyIcelandIDA & IBRD totalIDA blendIDA onlyIDA totalIndiaIndonesiaIran, Islamic Rep.IraqIrelandIsraelItalyJamaicaJapanJordanKazakhstanKenyaKorea, Rep.KuwaitKyrgyz RepublicLao PDRLate-demographic dividendLatin America & Caribbean Latin America & Caribbean (excluding high income)Latin America & the Caribbean (IDA & IBRD countries)LatviaLeast developed countries: UN classificationLebanonLesothoLiberiaLibyaLithuaniaLow & middle incomeLow incomeLower middle incomeLuxembourgMacao SAR, ChinaMacedonia, FYRMadagascarMalawiMalaysiaMaldivesMaliMaltaMauritaniaMauritiusMexicoMiddle East & North AfricaMiddle East & North Africa (excluding high income)Middle East & North Africa (IDA & IBRD countries)Middle incomeMoldovaMongoliaMontenegroMoroccoMozambiqueMyanmarNamibiaNepalNetherlandsNew ZealandNicaraguaNigerNigeriaNorth AmericaNorwayOECD membersOmanOther small statesPakistanPanamaPapua New GuineaParaguayPeruPhilippinesPolandPortugalPost-demographic dividendPre-demographic dividendQatarRomaniaRussian FederationRwandaSamoaSao Tome and PrincipeSaudi ArabiaSenegalSerbiaSeychellesSierra LeoneSingaporeSlovak RepublicSloveniaSmall statesSolomon IslandsSouth AfricaSouth AsiaSouth Asia (IDA & IBRD)South SudanSpainSri LankaSt. Kitts and NevisSt. LuciaSt. Vincent and the GrenadinesSub-Saharan Africa Sub-Saharan Africa (excluding high income)Sub-Saharan Africa (IDA & IBRD countries)SudanSurinameSwazilandSwedenSwitzerlandSyrian Arab RepublicTajikistanTanzaniaThailandTimor-LesteTogoTongaTrinidad and TobagoTunisiaTurkeyUgandaUkraineUnited KingdomUnited StatesUpper middle incomeUruguayVanuatuVenezuela, RBVietnamWorldYemen, Rep.ZambiaZimbabwe Timeline:
This timeline shows a graph from 1961 to 2016 of Honduras. No data until 1960. Number of actual observations by date: 56.
Source name:
World Development Indicators
Source organization:
International Monetary Fund, International Financial Statistics and data files.
Categories, topics:
Economy & Growth, Financial Sector
Last updated:
apr 23, 2017
Indicators value changes by year
Minimum:
-1.746
jan 1, 1961
Maximum:
33.972
jan 1, 1992
At the date of observation
Value
Absolute change
Change from previous value
jan 1, 1961
-1.746
-1.746
0.0%
jan 1, 1962
1.563
+3.309
-189.51%
jan 1, 1963
1.092
-0.471
-30.12%
jan 1, 1964
3.081
+1.989
182.15%
jan 1, 1965
4.472
+1.391
45.13%
jan 1, 1966
3.186
-1.286
-28.75%
jan 1, 1967
1.784
-1.402
-44.0%
jan 1, 1968
2.092
+0.308
17.24%
jan 1, 1969
1.861
-0.231
-11.02%
jan 1, 1970
1.258
-0.603
-32.4%
jan 1, 1971
2.881
+1.623
128.97%
jan 1, 1972
2.223
-0.658
-22.83%
jan 1, 1973
3.612
+1.389
62.48%
jan 1, 1974
5.193
+1.581
43.77%
jan 1, 1975
12.85
+7.656
147.43%
jan 1, 1976
8.376
-4.473
-34.81%
jan 1, 1977
4.883
-3.493
-41.7%
jan 1, 1978
8.435
+3.551
72.72%
jan 1, 1979
5.748
-2.686
-31.85%
jan 1, 1980
12.135
+6.387
111.11%
jan 1, 1981
18.062
+5.926
48.83%
jan 1, 1982
9.406
-8.656
-47.92%
jan 1, 1983
8.983
-0.423
-4.5%
jan 1, 1984
8.253
-0.73
-8.12%
jan 1, 1985
4.726
-3.526
-42.73%
jan 1, 1986
3.363
-1.364
-28.85%
jan 1, 1987
4.353
+0.99
29.44%
jan 1, 1988
2.487
-1.866
-42.86%
jan 1, 1989
4.491
+2.004
80.58%
jan 1, 1990
9.85
+5.359
119.32%
jan 1, 1991
23.323
+13.472
136.77%
jan 1, 1992
33.972
+10.65
45.66%
jan 1, 1993
8.76
-25.212
-74.21%
jan 1, 1994
10.749
+1.989
22.7%
jan 1, 1995
21.729
+10.981
102.16%
jan 1, 1996
29.465
+7.735
35.6%
jan 1, 1997
23.838
-5.627
-19.1%
jan 1, 1998
20.2
-3.638
-15.26%
jan 1, 1999
13.668
-6.532
-32.34%
jan 1, 2000
11.664
-2.004
-14.66%
jan 1, 2001
11.048
-0.616
-5.28%
jan 1, 2002
9.666
-1.382
-12.51%
jan 1, 2003
7.699
-1.967
-20.35%
jan 1, 2004
7.674
-0.025
-0.32%
jan 1, 2005
8.114
+0.44
5.73%
jan 1, 2006
8.809
+0.695
8.57%
jan 1, 2007
5.578
-3.231
-36.68%
jan 1, 2008
6.936
+1.358
24.36%
jan 1, 2009
11.406
+4.47
64.44%
jan 1, 2010
5.492
-5.914
-51.85%
jan 1, 2011
4.701
-0.791
-14.41%
jan 1, 2012
6.762
+2.062
43.86%
jan 1, 2013
5.196
-1.566
-23.16%
jan 1, 2014
5.162
-0.034
-0.66%
jan 1, 2015
6.129
+0.967
18.74%
jan 1, 2016
3.158
-2.971
-48.48%
Ranking of countries by current statistics by years


Comments: