29
/
en
AIzaSyAYiBZKx7MnpbEhh9jyipgxe19OcubqV5w
April 1, 2024
103752
Chad
TCD
true
2
1
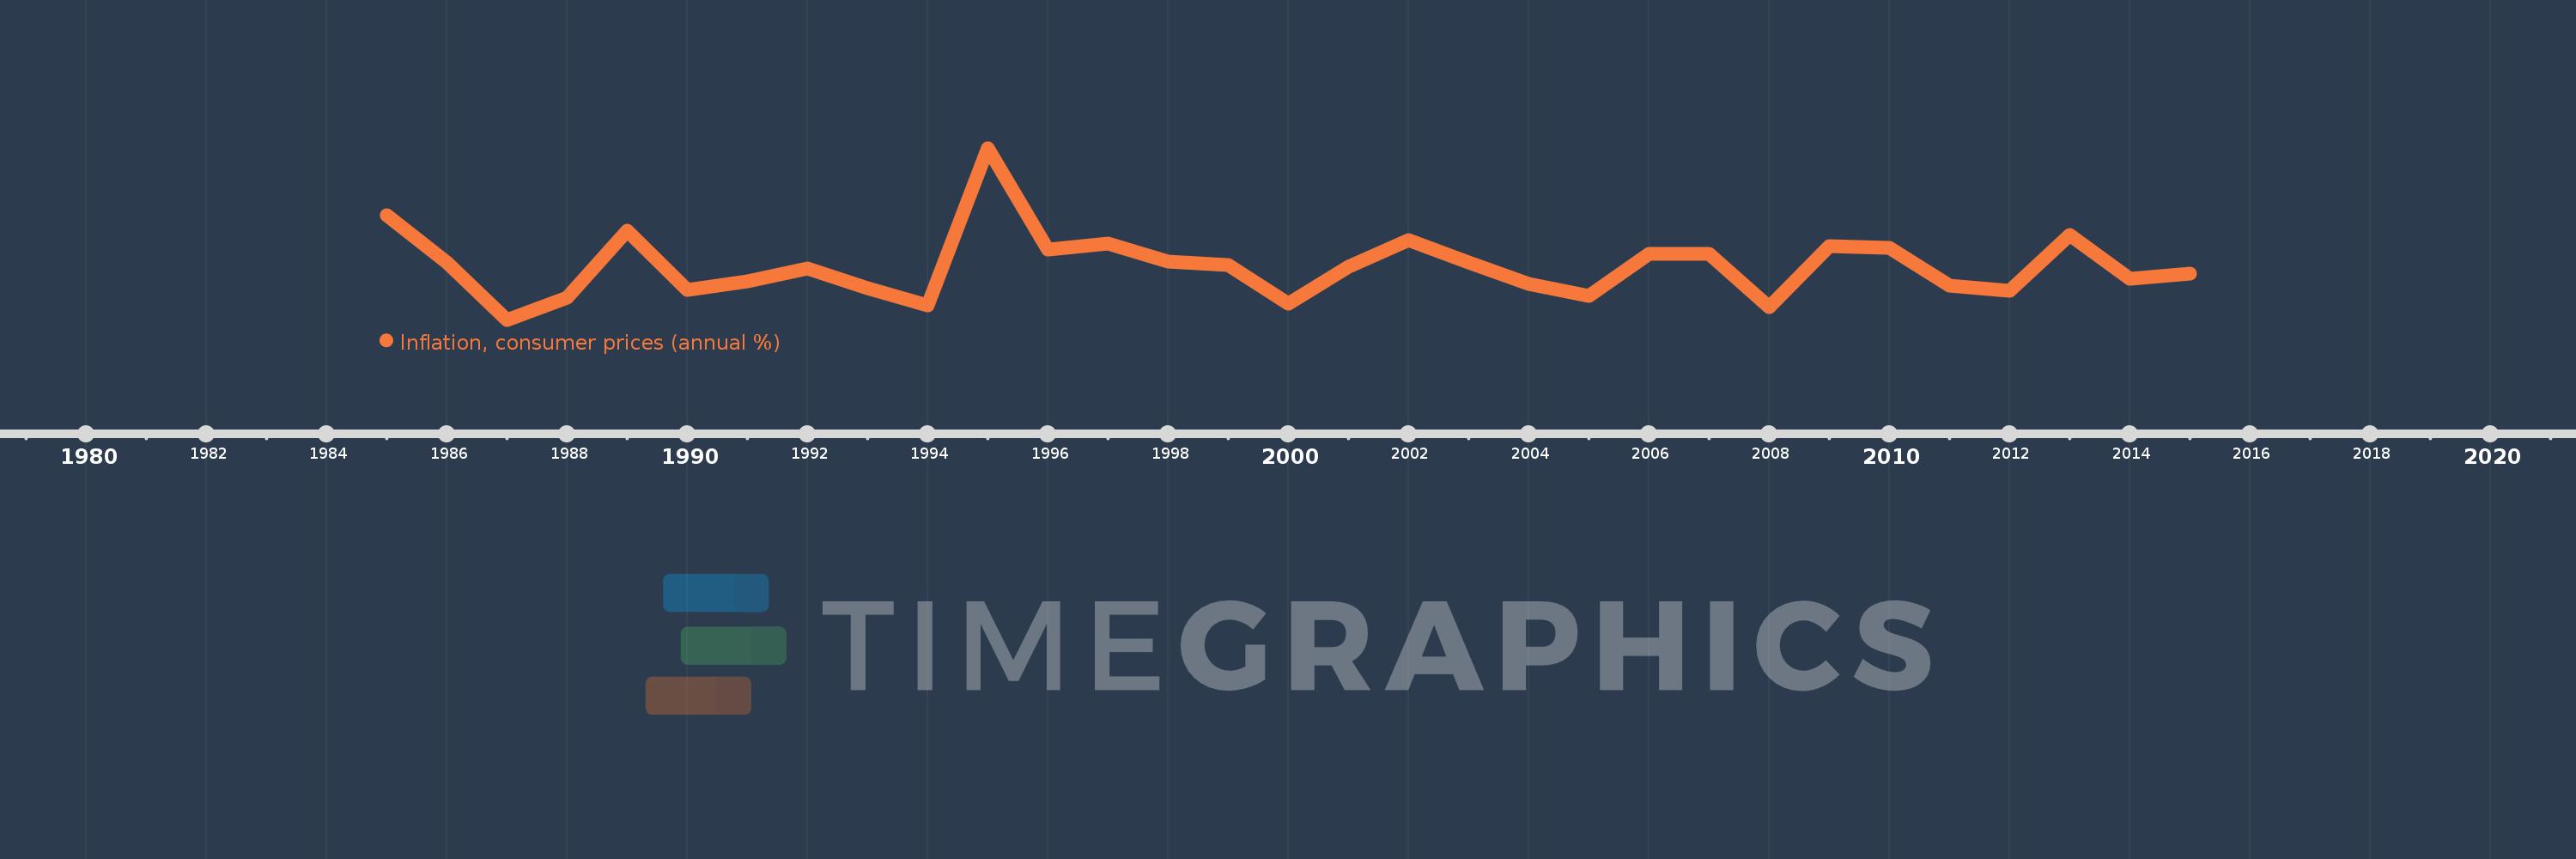
Inflation, consumer prices (annual %)
2015,2014,2013,2012,2011,2010,2009,2008,2007,2006,2005,2004,2003,2002,2001,2000,1999,1998,1997,1996,1995,1994,1993,1992,1991,1990,1989,1988,1987,1986,1985
This statistics in other country:
AfghanistanAlbaniaAlgeriaAngolaAntigua and BarbudaArab WorldArgentinaArmeniaArubaAustraliaAustriaAzerbaijanBahamas, TheBahrainBangladeshBarbadosBelarusBelgiumBelizeBeninBhutanBoliviaBotswanaBrazilBrunei DarussalamBulgariaBurkina FasoBurundiCabo VerdeCambodiaCameroonCanadaCaribbean small statesCentral African RepublicCentral Europe and the BalticsChadChileChinaColombiaComorosCongo, Dem. Rep.Congo, Rep.Costa RicaCote d'IvoireCroatiaCyprusCzech RepublicDenmarkDjiboutiDominicaDominican RepublicEarly-demographic dividendEast Asia & PacificEast Asia & Pacific (excluding high income)East Asia & Pacific (IDA & IBRD countries)EcuadorEgypt, Arab Rep.El SalvadorEquatorial GuineaEstoniaEthiopiaEuro areaEurope & Central AsiaEurope & Central Asia (excluding high income)Europe & Central Asia (IDA & IBRD countries)European UnionFijiFinlandFragile and conflict affected situationsFranceGabonGambia, TheGeorgiaGermanyGhanaGreeceGrenadaGuatemalaGuineaGuinea-BissauGuyanaHaitiHeavily indebted poor countries (HIPC)High incomeHondurasHong Kong SAR, ChinaHungaryIBRD onlyIcelandIDA & IBRD totalIDA blendIDA onlyIDA totalIndiaIndonesiaIran, Islamic Rep.IraqIrelandIsraelItalyJamaicaJapanJordanKazakhstanKenyaKorea, Rep.KuwaitKyrgyz RepublicLao PDRLate-demographic dividendLatin America & Caribbean Latin America & Caribbean (excluding high income)Latin America & the Caribbean (IDA & IBRD countries)LatviaLeast developed countries: UN classificationLebanonLesothoLiberiaLibyaLithuaniaLow & middle incomeLow incomeLower middle incomeLuxembourgMacao SAR, ChinaMacedonia, FYRMadagascarMalawiMalaysiaMaldivesMaliMaltaMauritaniaMauritiusMexicoMiddle East & North AfricaMiddle East & North Africa (excluding high income)Middle East & North Africa (IDA & IBRD countries)Middle incomeMoldovaMongoliaMontenegroMoroccoMozambiqueMyanmarNamibiaNepalNetherlandsNew ZealandNicaraguaNigerNigeriaNorth AmericaNorwayOECD membersOmanOther small statesPakistanPanamaPapua New GuineaParaguayPeruPhilippinesPolandPortugalPost-demographic dividendPre-demographic dividendQatarRomaniaRussian FederationRwandaSamoaSao Tome and PrincipeSaudi ArabiaSenegalSerbiaSeychellesSierra LeoneSingaporeSlovak RepublicSloveniaSmall statesSolomon IslandsSouth AfricaSouth AsiaSouth Asia (IDA & IBRD)South SudanSpainSri LankaSt. Kitts and NevisSt. LuciaSt. Vincent and the GrenadinesSub-Saharan Africa Sub-Saharan Africa (excluding high income)Sub-Saharan Africa (IDA & IBRD countries)SudanSurinameSwazilandSwedenSwitzerlandSyrian Arab RepublicTajikistanTanzaniaThailandTimor-LesteTogoTongaTrinidad and TobagoTunisiaTurkeyUgandaUkraineUnited KingdomUnited StatesUpper middle incomeUruguayVanuatuVenezuela, RBVietnamWorldYemen, Rep.ZambiaZimbabwe Timeline:
This timeline shows a graph from 1985 to 2015 of Chad. No data until 1984. Number of actual observations by date: 31.
Source name:
World Development Indicators
Source organization:
International Monetary Fund, International Financial Statistics and data files.
Categories, topics:
Economy & Growth, Financial Sector
Last updated:
apr 23, 2017
Indicators value changes by year
Minimum:
-13.057
jan 1, 1987
Maximum:
41.725
jan 1, 1995
At the date of observation
Value
Absolute change
Change from previous value
jan 1, 1985
20.251
+20.251
0.0%
jan 1, 1986
5.154
-15.097
-74.55%
jan 1, 1987
-13.057
-18.211
-353.33%
jan 1, 1988
-5.975
+7.082
-54.24%
jan 1, 1989
15.478
+21.452
-359.04%
jan 1, 1990
-3.689
-19.167
-123.84%
jan 1, 1991
-0.738
+2.951
-79.99%
jan 1, 1992
3.194
+3.932
-532.61%
jan 1, 1993
-3.113
-6.307
-197.47%
jan 1, 1994
-8.428
-5.315
170.73%
jan 1, 1995
41.725
+50.153
-595.08%
jan 1, 1996
9.23
-32.495
-77.88%
jan 1, 1997
11.331
+2.101
22.76%
jan 1, 1998
5.572
-5.759
-50.82%
jan 1, 1999
4.259
-1.313
-23.57%
jan 1, 2000
-8.025
-12.284
-288.43%
jan 1, 2001
3.823
+11.848
-147.63%
jan 1, 2002
12.431
+8.609
225.2%
jan 1, 2003
5.192
-7.239
-58.24%
jan 1, 2004
-1.753
-6.944
-133.76%
jan 1, 2005
-5.355
-3.603
205.57%
jan 1, 2006
7.89
+13.246
-247.33%
jan 1, 2007
8.036
+0.146
1.85%
jan 1, 2008
-8.975
-17.011
-211.68%
jan 1, 2009
10.297
+19.272
-214.73%
jan 1, 2010
9.952
-0.345
-3.35%
jan 1, 2011
-2.078
-12.03
-120.88%
jan 1, 2012
-3.704
-1.626
78.27%
jan 1, 2013
14.018
+17.723
-478.43%
jan 1, 2014
0.145
-13.873
-98.96%
jan 1, 2015
1.681
+1.535
1.06K%
Ranking of countries by current statistics by years


Comments: