29
/
en
AIzaSyAYiBZKx7MnpbEhh9jyipgxe19OcubqV5w
April 1, 2024
28228
East Asia & Pacific (excluding high income)
EAP
false
2
1
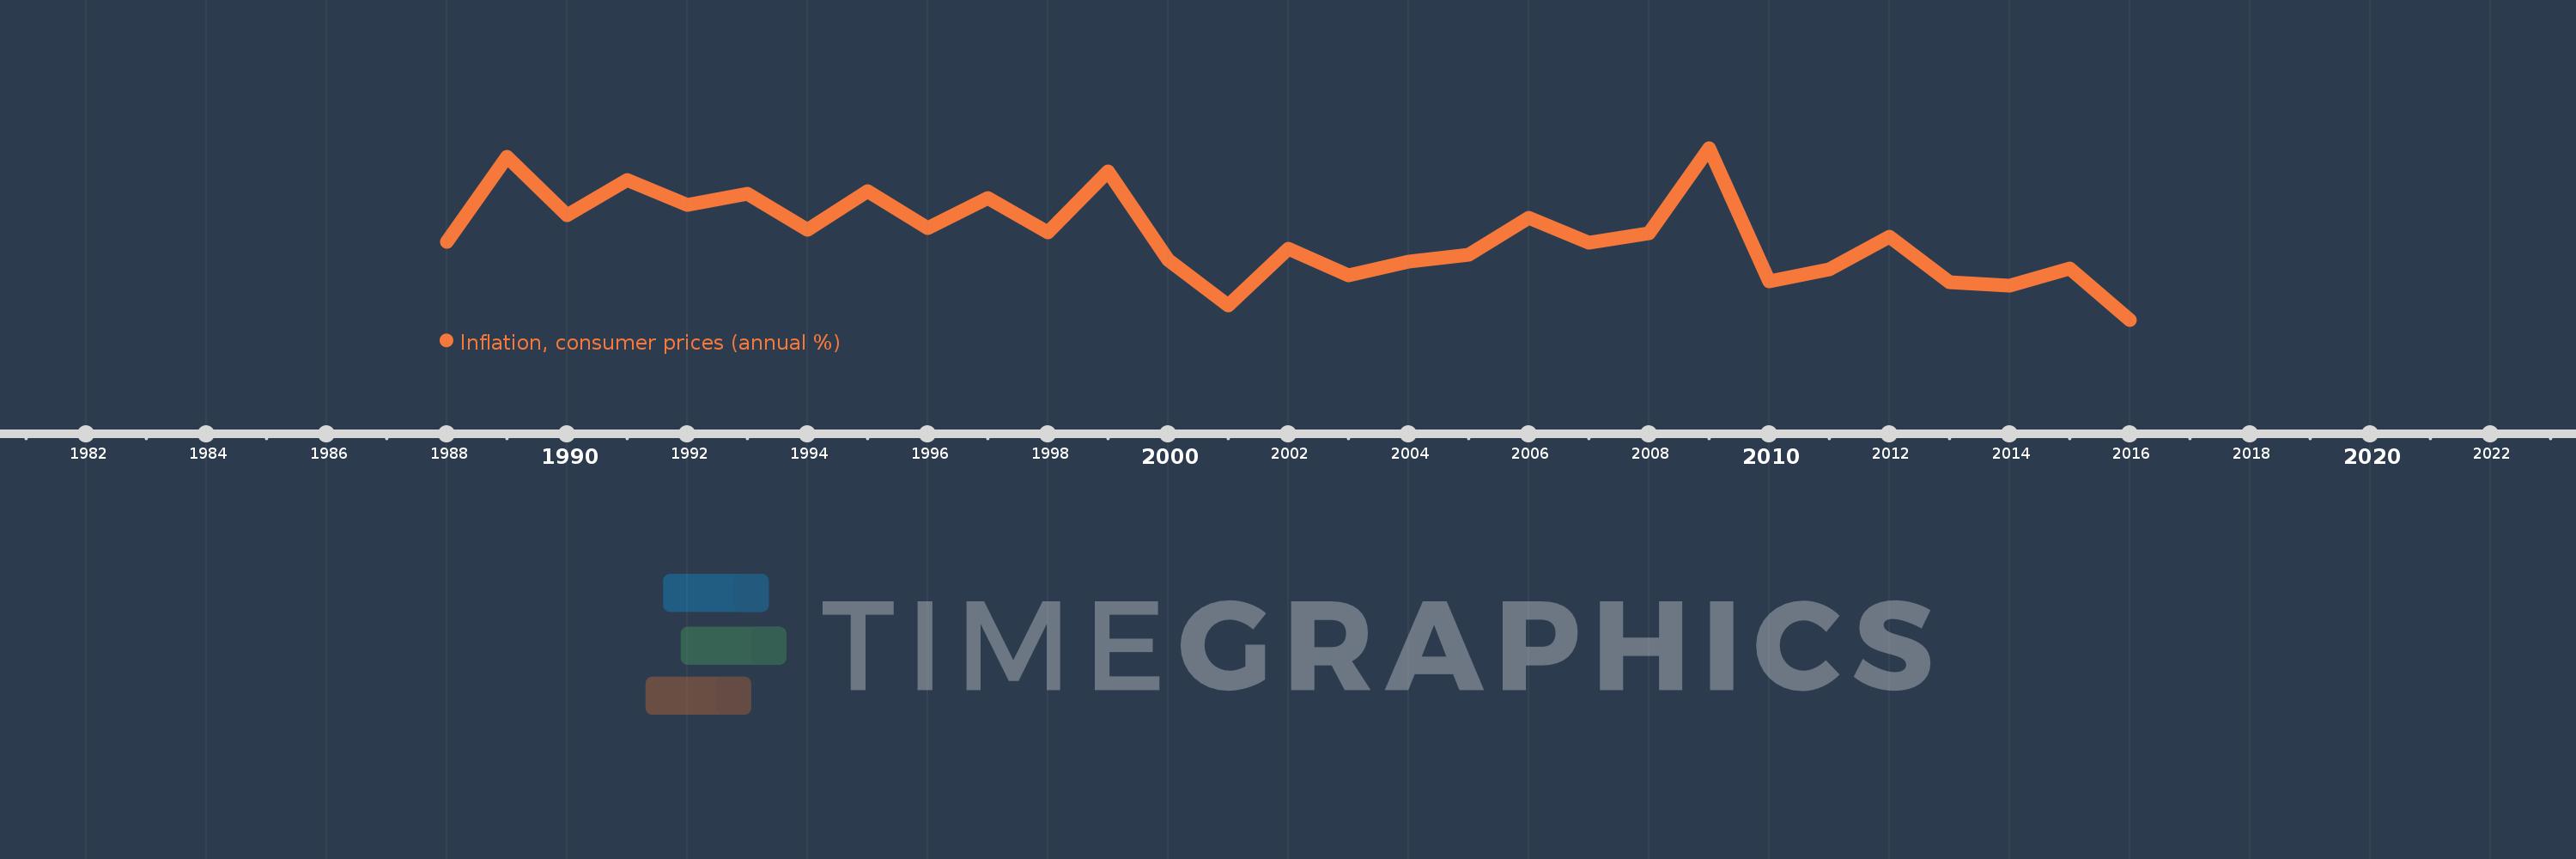
Inflation, consumer prices (annual %)
2016,2015,2014,2013,2012,2011,2010,2009,2008,2007,2006,2005,2004,2003,2002,2001,2000,1999,1998,1997,1996,1995,1994,1993,1992,1991,1990,1989,1988
This statistics in other country:
AfghanistanAlbaniaAlgeriaAngolaAntigua and BarbudaArab WorldArgentinaArmeniaArubaAustraliaAustriaAzerbaijanBahamas, TheBahrainBangladeshBarbadosBelarusBelgiumBelizeBeninBhutanBoliviaBotswanaBrazilBrunei DarussalamBulgariaBurkina FasoBurundiCabo VerdeCambodiaCameroonCanadaCaribbean small statesCentral African RepublicCentral Europe and the BalticsChadChileChinaColombiaComorosCongo, Dem. Rep.Congo, Rep.Costa RicaCote d'IvoireCroatiaCyprusCzech RepublicDenmarkDjiboutiDominicaDominican RepublicEarly-demographic dividendEast Asia & PacificEast Asia & Pacific (excluding high income)East Asia & Pacific (IDA & IBRD countries)EcuadorEgypt, Arab Rep.El SalvadorEquatorial GuineaEstoniaEthiopiaEuro areaEurope & Central AsiaEurope & Central Asia (excluding high income)Europe & Central Asia (IDA & IBRD countries)European UnionFijiFinlandFragile and conflict affected situationsFranceGabonGambia, TheGeorgiaGermanyGhanaGreeceGrenadaGuatemalaGuineaGuinea-BissauGuyanaHaitiHeavily indebted poor countries (HIPC)High incomeHondurasHong Kong SAR, ChinaHungaryIBRD onlyIcelandIDA & IBRD totalIDA blendIDA onlyIDA totalIndiaIndonesiaIran, Islamic Rep.IraqIrelandIsraelItalyJamaicaJapanJordanKazakhstanKenyaKorea, Rep.KuwaitKyrgyz RepublicLao PDRLate-demographic dividendLatin America & Caribbean Latin America & Caribbean (excluding high income)Latin America & the Caribbean (IDA & IBRD countries)LatviaLeast developed countries: UN classificationLebanonLesothoLiberiaLibyaLithuaniaLow & middle incomeLow incomeLower middle incomeLuxembourgMacao SAR, ChinaMacedonia, FYRMadagascarMalawiMalaysiaMaldivesMaliMaltaMauritaniaMauritiusMexicoMiddle East & North AfricaMiddle East & North Africa (excluding high income)Middle East & North Africa (IDA & IBRD countries)Middle incomeMoldovaMongoliaMontenegroMoroccoMozambiqueMyanmarNamibiaNepalNetherlandsNew ZealandNicaraguaNigerNigeriaNorth AmericaNorwayOECD membersOmanOther small statesPakistanPanamaPapua New GuineaParaguayPeruPhilippinesPolandPortugalPost-demographic dividendPre-demographic dividendQatarRomaniaRussian FederationRwandaSamoaSao Tome and PrincipeSaudi ArabiaSenegalSerbiaSeychellesSierra LeoneSingaporeSlovak RepublicSloveniaSmall statesSolomon IslandsSouth AfricaSouth AsiaSouth Asia (IDA & IBRD)South SudanSpainSri LankaSt. Kitts and NevisSt. LuciaSt. Vincent and the GrenadinesSub-Saharan Africa Sub-Saharan Africa (excluding high income)Sub-Saharan Africa (IDA & IBRD countries)SudanSurinameSwazilandSwedenSwitzerlandSyrian Arab RepublicTajikistanTanzaniaThailandTimor-LesteTogoTongaTrinidad and TobagoTunisiaTurkeyUgandaUkraineUnited KingdomUnited StatesUpper middle incomeUruguayVanuatuVenezuela, RBVietnamWorldYemen, Rep.ZambiaZimbabwe Timeline:
This timeline shows a graph from 1988 to 2016 of East Asia & Pacific (excluding high income). No data until 1987. Number of actual observations by date: 29.
Source name:
World Development Indicators
Source organization:
International Monetary Fund, International Financial Statistics and data files.
Categories, topics:
Economy & Growth, Financial Sector
Last updated:
apr 23, 2017
Indicators value changes by year
At the date of observation
Value
Absolute change
Change from previous value
jan 1, 1988
5.175
+5.175
0.0%
jan 1, 1989
9.342
+4.167
80.53%
jan 1, 1990
6.463
-2.88
-30.82%
jan 1, 1991
8.191
+1.729
26.75%
jan 1, 1992
6.966
-1.226
-14.96%
jan 1, 1993
7.526
+0.56
8.04%
jan 1, 1994
5.737
-1.789
-23.77%
jan 1, 1995
7.651
+1.915
33.37%
jan 1, 1996
5.818
-1.833
-23.96%
jan 1, 1997
7.313
+1.495
25.7%
jan 1, 1998
5.608
-1.705
-23.32%
jan 1, 1999
8.615
+3.007
53.62%
jan 1, 2000
4.291
-4.324
-50.19%
jan 1, 2001
2.027
-2.264
-52.76%
jan 1, 2002
4.809
+2.782
137.23%
jan 1, 2003
3.528
-1.281
-26.64%
jan 1, 2004
4.173
+0.645
18.28%
jan 1, 2005
4.534
+0.361
8.66%
jan 1, 2006
6.349
+1.815
40.03%
jan 1, 2007
5.095
-1.254
-19.75%
jan 1, 2008
5.577
+0.482
9.46%
jan 1, 2009
9.777
+4.2
75.3%
jan 1, 2010
3.215
-6.562
-67.12%
jan 1, 2011
3.79
+0.575
17.89%
jan 1, 2012
5.411
+1.621
42.77%
jan 1, 2013
3.172
-2.239
-41.38%
jan 1, 2014
2.998
-0.174
-5.5%
jan 1, 2015
3.855
+0.858
28.61%
jan 1, 2016
1.324
-2.532
-65.67%
Ranking of countries by current statistics by years


Comments: