29
/
en
AIzaSyAYiBZKx7MnpbEhh9jyipgxe19OcubqV5w
April 1, 2024
243728
Solomon Islands
SLB
true
2
1
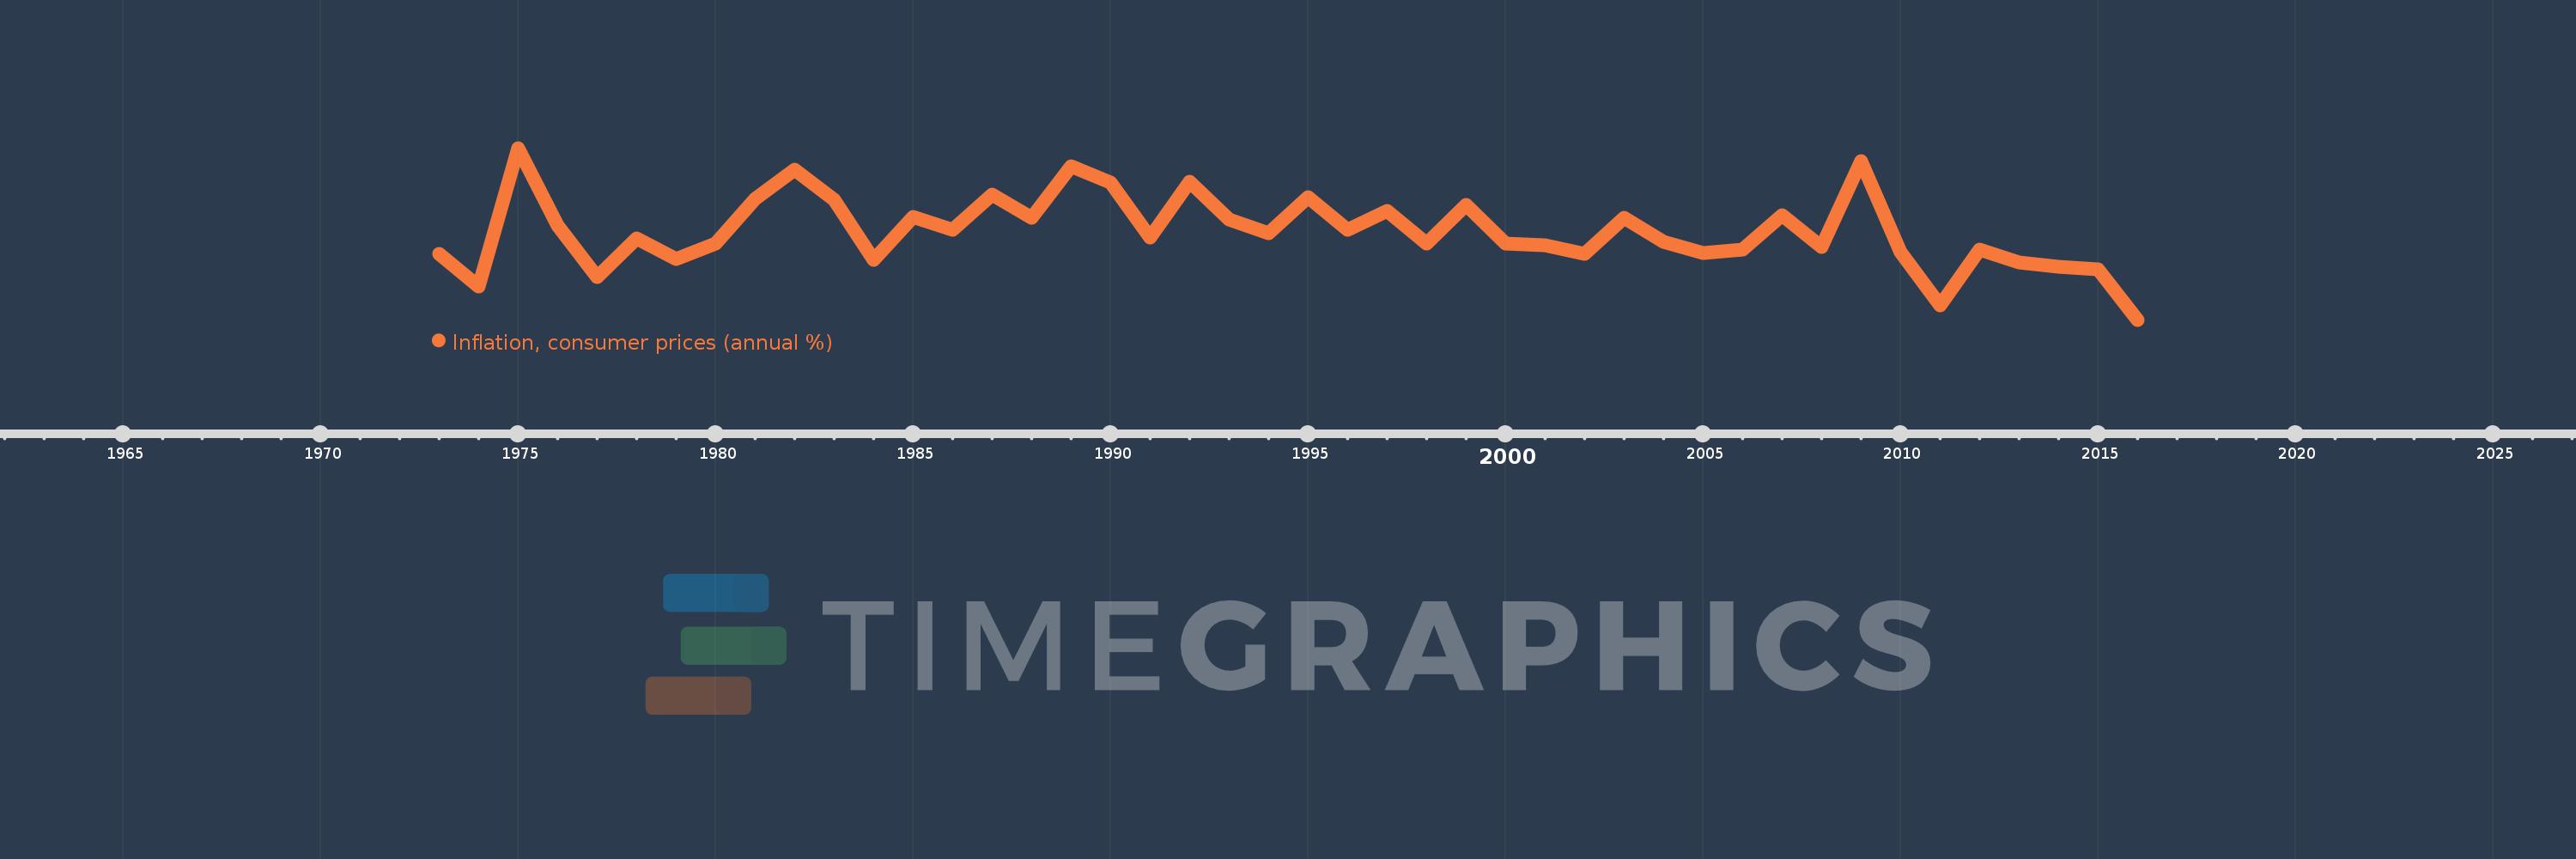
Inflation, consumer prices (annual %)
2016,2015,2014,2013,2012,2011,2010,2009,2008,2007,2006,2005,2004,2003,2002,2001,2000,1999,1998,1997,1996,1995,1994,1993,1992,1991,1990,1989,1988,1987,1986,1985,1984,1983,1982,1981,1980,1979,1978,1977,1976,1975,1974,1973
This statistics in other country:
AfghanistanAlbaniaAlgeriaAngolaAntigua and BarbudaArab WorldArgentinaArmeniaArubaAustraliaAustriaAzerbaijanBahamas, TheBahrainBangladeshBarbadosBelarusBelgiumBelizeBeninBhutanBoliviaBotswanaBrazilBrunei DarussalamBulgariaBurkina FasoBurundiCabo VerdeCambodiaCameroonCanadaCaribbean small statesCentral African RepublicCentral Europe and the BalticsChadChileChinaColombiaComorosCongo, Dem. Rep.Congo, Rep.Costa RicaCote d'IvoireCroatiaCyprusCzech RepublicDenmarkDjiboutiDominicaDominican RepublicEarly-demographic dividendEast Asia & PacificEast Asia & Pacific (excluding high income)East Asia & Pacific (IDA & IBRD countries)EcuadorEgypt, Arab Rep.El SalvadorEquatorial GuineaEstoniaEthiopiaEuro areaEurope & Central AsiaEurope & Central Asia (excluding high income)Europe & Central Asia (IDA & IBRD countries)European UnionFijiFinlandFragile and conflict affected situationsFranceGabonGambia, TheGeorgiaGermanyGhanaGreeceGrenadaGuatemalaGuineaGuinea-BissauGuyanaHaitiHeavily indebted poor countries (HIPC)High incomeHondurasHong Kong SAR, ChinaHungaryIBRD onlyIcelandIDA & IBRD totalIDA blendIDA onlyIDA totalIndiaIndonesiaIran, Islamic Rep.IraqIrelandIsraelItalyJamaicaJapanJordanKazakhstanKenyaKorea, Rep.KuwaitKyrgyz RepublicLao PDRLate-demographic dividendLatin America & Caribbean Latin America & Caribbean (excluding high income)Latin America & the Caribbean (IDA & IBRD countries)LatviaLeast developed countries: UN classificationLebanonLesothoLiberiaLibyaLithuaniaLow & middle incomeLow incomeLower middle incomeLuxembourgMacao SAR, ChinaMacedonia, FYRMadagascarMalawiMalaysiaMaldivesMaliMaltaMauritaniaMauritiusMexicoMiddle East & North AfricaMiddle East & North Africa (excluding high income)Middle East & North Africa (IDA & IBRD countries)Middle incomeMoldovaMongoliaMontenegroMoroccoMozambiqueMyanmarNamibiaNepalNetherlandsNew ZealandNicaraguaNigerNigeriaNorth AmericaNorwayOECD membersOmanOther small statesPakistanPanamaPapua New GuineaParaguayPeruPhilippinesPolandPortugalPost-demographic dividendPre-demographic dividendQatarRomaniaRussian FederationRwandaSamoaSao Tome and PrincipeSaudi ArabiaSenegalSerbiaSeychellesSierra LeoneSingaporeSlovak RepublicSloveniaSmall statesSolomon IslandsSouth AfricaSouth AsiaSouth Asia (IDA & IBRD)South SudanSpainSri LankaSt. Kitts and NevisSt. LuciaSt. Vincent and the GrenadinesSub-Saharan Africa Sub-Saharan Africa (excluding high income)Sub-Saharan Africa (IDA & IBRD countries)SudanSurinameSwazilandSwedenSwitzerlandSyrian Arab RepublicTajikistanTanzaniaThailandTimor-LesteTogoTongaTrinidad and TobagoTunisiaTurkeyUgandaUkraineUnited KingdomUnited StatesUpper middle incomeUruguayVanuatuVenezuela, RBVietnamWorldYemen, Rep.ZambiaZimbabwe Timeline:
This timeline shows a graph from 1973 to 2016 of Solomon Islands. No data until 1972. Number of actual observations by date: 44.
Source name:
World Development Indicators
Source organization:
International Monetary Fund, International Financial Statistics and data files.
Categories, topics:
Economy & Growth, Financial Sector
Last updated:
apr 23, 2017
Indicators value changes by year
Minimum:
-0.559
jan 1, 2016
Maximum:
18.853
jan 1, 1975
At the date of observation
Value
Absolute change
Change from previous value
jan 1, 1973
6.878
+6.878
0.0%
jan 1, 1974
3.229
-3.649
-53.05%
jan 1, 1975
18.853
+15.624
483.92%
jan 1, 1976
10.069
-8.784
-46.59%
jan 1, 1977
4.255
-5.814
-57.74%
jan 1, 1978
8.617
+4.361
102.49%
jan 1, 1979
6.263
-2.354
-27.32%
jan 1, 1980
8.055
+1.792
28.61%
jan 1, 1981
13.091
+5.036
62.52%
jan 1, 1982
16.399
+3.308
25.27%
jan 1, 1983
12.983
-3.415
-20.83%
jan 1, 1984
6.235
-6.749
-51.98%
jan 1, 1985
11.047
+4.812
77.19%
jan 1, 1986
9.568
-1.479
-13.39%
jan 1, 1987
13.572
+4.004
41.84%
jan 1, 1988
10.992
-2.58
-19.01%
jan 1, 1989
16.738
+5.745
52.26%
jan 1, 1990
14.932
-1.805
-10.79%
jan 1, 1991
8.738
-6.195
-41.49%
jan 1, 1992
15.05
+6.313
72.25%
jan 1, 1993
10.751
-4.299
-28.56%
jan 1, 1994
9.169
-1.582
-14.72%
jan 1, 1995
13.256
+4.087
44.58%
jan 1, 1996
9.629
-3.627
-27.36%
jan 1, 1997
11.774
+2.145
22.28%
jan 1, 1998
8.084
-3.69
-31.34%
jan 1, 1999
12.4
+4.316
53.38%
jan 1, 2000
8.02
-4.379
-35.32%
jan 1, 2001
7.89
-0.131
-1.63%
jan 1, 2002
6.926
-0.964
-12.22%
jan 1, 2003
10.93
+4.004
57.81%
jan 1, 2004
8.269
-2.66
-24.34%
jan 1, 2005
6.986
-1.284
-15.52%
jan 1, 2006
7.331
+0.345
4.94%
jan 1, 2007
11.22
+3.889
53.06%
jan 1, 2008
7.666
-3.554
-31.68%
jan 1, 2009
17.32
+9.654
125.93%
jan 1, 2010
7.093
-10.227
-59.05%
jan 1, 2011
1.051
-6.041
-85.18%
jan 1, 2012
7.343
+6.291
598.32%
jan 1, 2013
5.912
-1.431
-19.48%
jan 1, 2014
5.391
-0.521
-8.81%
jan 1, 2015
5.166
-0.225
-4.18%
jan 1, 2016
-0.559
-5.724
-110.81%
Ranking of countries by current statistics by years


Comments: