29
/
en
AIzaSyAYiBZKx7MnpbEhh9jyipgxe19OcubqV5w
April 1, 2024
203077
Mozambique
MOZ
true
2
1
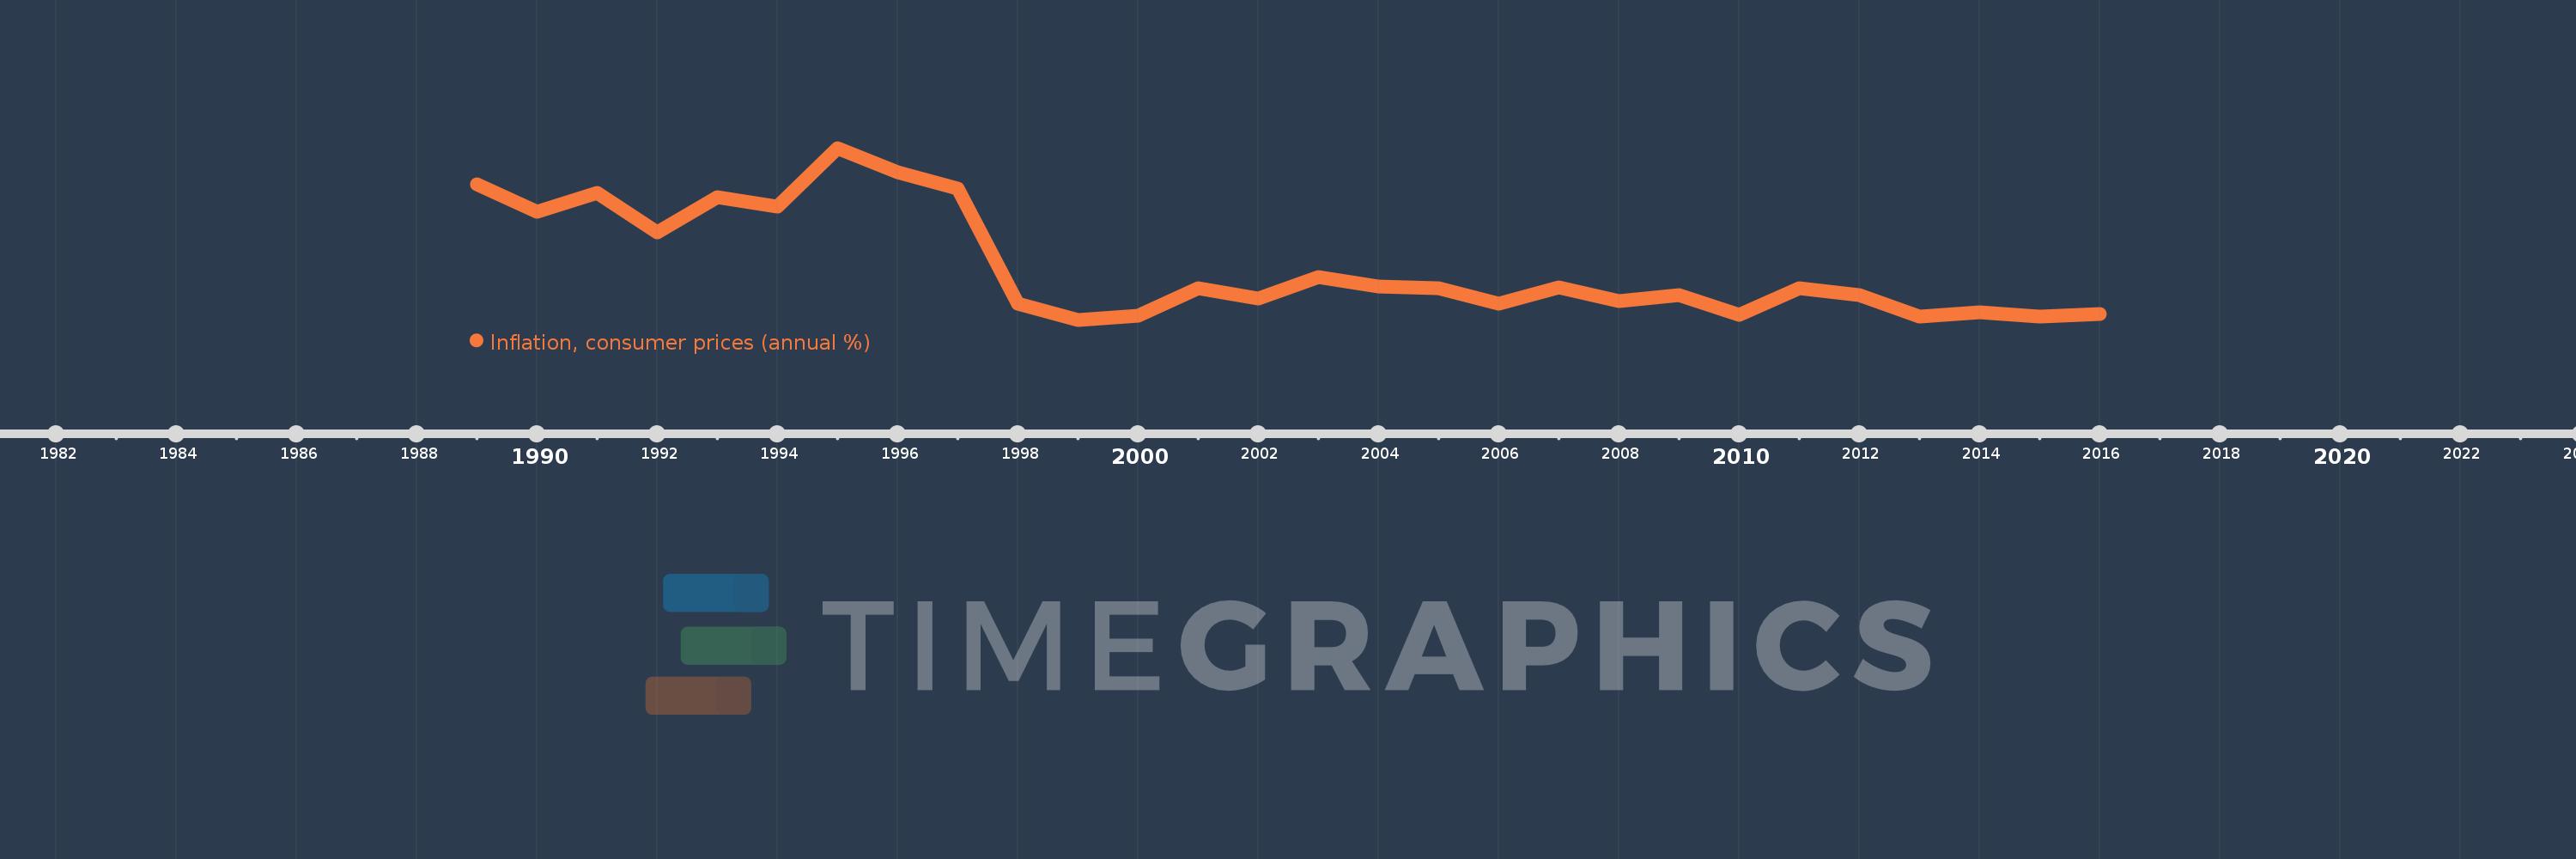
Inflation, consumer prices (annual %)
2016,2015,2014,2013,2012,2011,2010,2009,2008,2007,2006,2005,2004,2003,2002,2001,2000,1999,1998,1997,1996,1995,1994,1993,1992,1991,1990,1989
This statistics in other country:
AfghanistanAlbaniaAlgeriaAngolaAntigua and BarbudaArab WorldArgentinaArmeniaArubaAustraliaAustriaAzerbaijanBahamas, TheBahrainBangladeshBarbadosBelarusBelgiumBelizeBeninBhutanBoliviaBotswanaBrazilBrunei DarussalamBulgariaBurkina FasoBurundiCabo VerdeCambodiaCameroonCanadaCaribbean small statesCentral African RepublicCentral Europe and the BalticsChadChileChinaColombiaComorosCongo, Dem. Rep.Congo, Rep.Costa RicaCote d'IvoireCroatiaCyprusCzech RepublicDenmarkDjiboutiDominicaDominican RepublicEarly-demographic dividendEast Asia & PacificEast Asia & Pacific (excluding high income)East Asia & Pacific (IDA & IBRD countries)EcuadorEgypt, Arab Rep.El SalvadorEquatorial GuineaEstoniaEthiopiaEuro areaEurope & Central AsiaEurope & Central Asia (excluding high income)Europe & Central Asia (IDA & IBRD countries)European UnionFijiFinlandFragile and conflict affected situationsFranceGabonGambia, TheGeorgiaGermanyGhanaGreeceGrenadaGuatemalaGuineaGuinea-BissauGuyanaHaitiHeavily indebted poor countries (HIPC)High incomeHondurasHong Kong SAR, ChinaHungaryIBRD onlyIcelandIDA & IBRD totalIDA blendIDA onlyIDA totalIndiaIndonesiaIran, Islamic Rep.IraqIrelandIsraelItalyJamaicaJapanJordanKazakhstanKenyaKorea, Rep.KuwaitKyrgyz RepublicLao PDRLate-demographic dividendLatin America & Caribbean Latin America & Caribbean (excluding high income)Latin America & the Caribbean (IDA & IBRD countries)LatviaLeast developed countries: UN classificationLebanonLesothoLiberiaLibyaLithuaniaLow & middle incomeLow incomeLower middle incomeLuxembourgMacao SAR, ChinaMacedonia, FYRMadagascarMalawiMalaysiaMaldivesMaliMaltaMauritaniaMauritiusMexicoMiddle East & North AfricaMiddle East & North Africa (excluding high income)Middle East & North Africa (IDA & IBRD countries)Middle incomeMoldovaMongoliaMontenegroMoroccoMozambiqueMyanmarNamibiaNepalNetherlandsNew ZealandNicaraguaNigerNigeriaNorth AmericaNorwayOECD membersOmanOther small statesPakistanPanamaPapua New GuineaParaguayPeruPhilippinesPolandPortugalPost-demographic dividendPre-demographic dividendQatarRomaniaRussian FederationRwandaSamoaSao Tome and PrincipeSaudi ArabiaSenegalSerbiaSeychellesSierra LeoneSingaporeSlovak RepublicSloveniaSmall statesSolomon IslandsSouth AfricaSouth AsiaSouth Asia (IDA & IBRD)South SudanSpainSri LankaSt. Kitts and NevisSt. LuciaSt. Vincent and the GrenadinesSub-Saharan Africa Sub-Saharan Africa (excluding high income)Sub-Saharan Africa (IDA & IBRD countries)SudanSurinameSwazilandSwedenSwitzerlandSyrian Arab RepublicTajikistanTanzaniaThailandTimor-LesteTogoTongaTrinidad and TobagoTunisiaTurkeyUgandaUkraineUnited KingdomUnited StatesUpper middle incomeUruguayVanuatuVenezuela, RBVietnamWorldYemen, Rep.ZambiaZimbabwe Timeline:
This timeline shows a graph from 1989 to 2016 of Mozambique. No data until 1988. Number of actual observations by date: 28.
Source name:
World Development Indicators
Source organization:
International Monetary Fund, International Financial Statistics and data files.
Categories, topics:
Economy & Growth, Financial Sector
Last updated:
apr 23, 2017
Indicators value changes by year
Maximum:
63.183
jan 1, 1995
At the date of observation
Value
Absolute change
Change from previous value
jan 1, 1989
50.137
+50.137
0.0%
jan 1, 1990
40.146
-9.991
-19.93%
jan 1, 1991
47.005
+6.859
17.09%
jan 1, 1992
32.933
-14.072
-29.94%
jan 1, 1993
45.485
+12.552
38.11%
jan 1, 1994
42.2
-3.285
-7.22%
jan 1, 1995
63.183
+20.983
49.72%
jan 1, 1996
54.434
-8.749
-13.85%
jan 1, 1997
48.491
-5.943
-10.92%
jan 1, 1998
7.369
-41.122
-84.8%
jan 1, 1999
1.48
-5.889
-79.91%
jan 1, 2000
2.86
+1.379
93.16%
jan 1, 2001
12.724
+9.864
344.96%
jan 1, 2002
9.05
-3.674
-28.87%
jan 1, 2003
16.781
+7.731
85.43%
jan 1, 2004
13.426
-3.355
-19.99%
jan 1, 2005
12.663
-0.763
-5.68%
jan 1, 2006
7.168
-5.496
-43.4%
jan 1, 2007
13.239
+6.071
84.7%
jan 1, 2008
8.163
-5.076
-38.34%
jan 1, 2009
10.328
+2.165
26.53%
jan 1, 2010
3.252
-7.076
-68.52%
jan 1, 2011
12.701
+9.45
290.6%
jan 1, 2012
10.351
-2.35
-18.5%
jan 1, 2013
2.681
-7.67
-74.1%
jan 1, 2014
4.261
+1.58
58.95%
jan 1, 2015
2.56
-1.702
-39.93%
jan 1, 2016
3.551
+0.991
38.72%
Ranking of countries by current statistics by years


Comments: