29
/
en
AIzaSyAYiBZKx7MnpbEhh9jyipgxe19OcubqV5w
April 1, 2024
162711
Jamaica
JAM
true
2
1
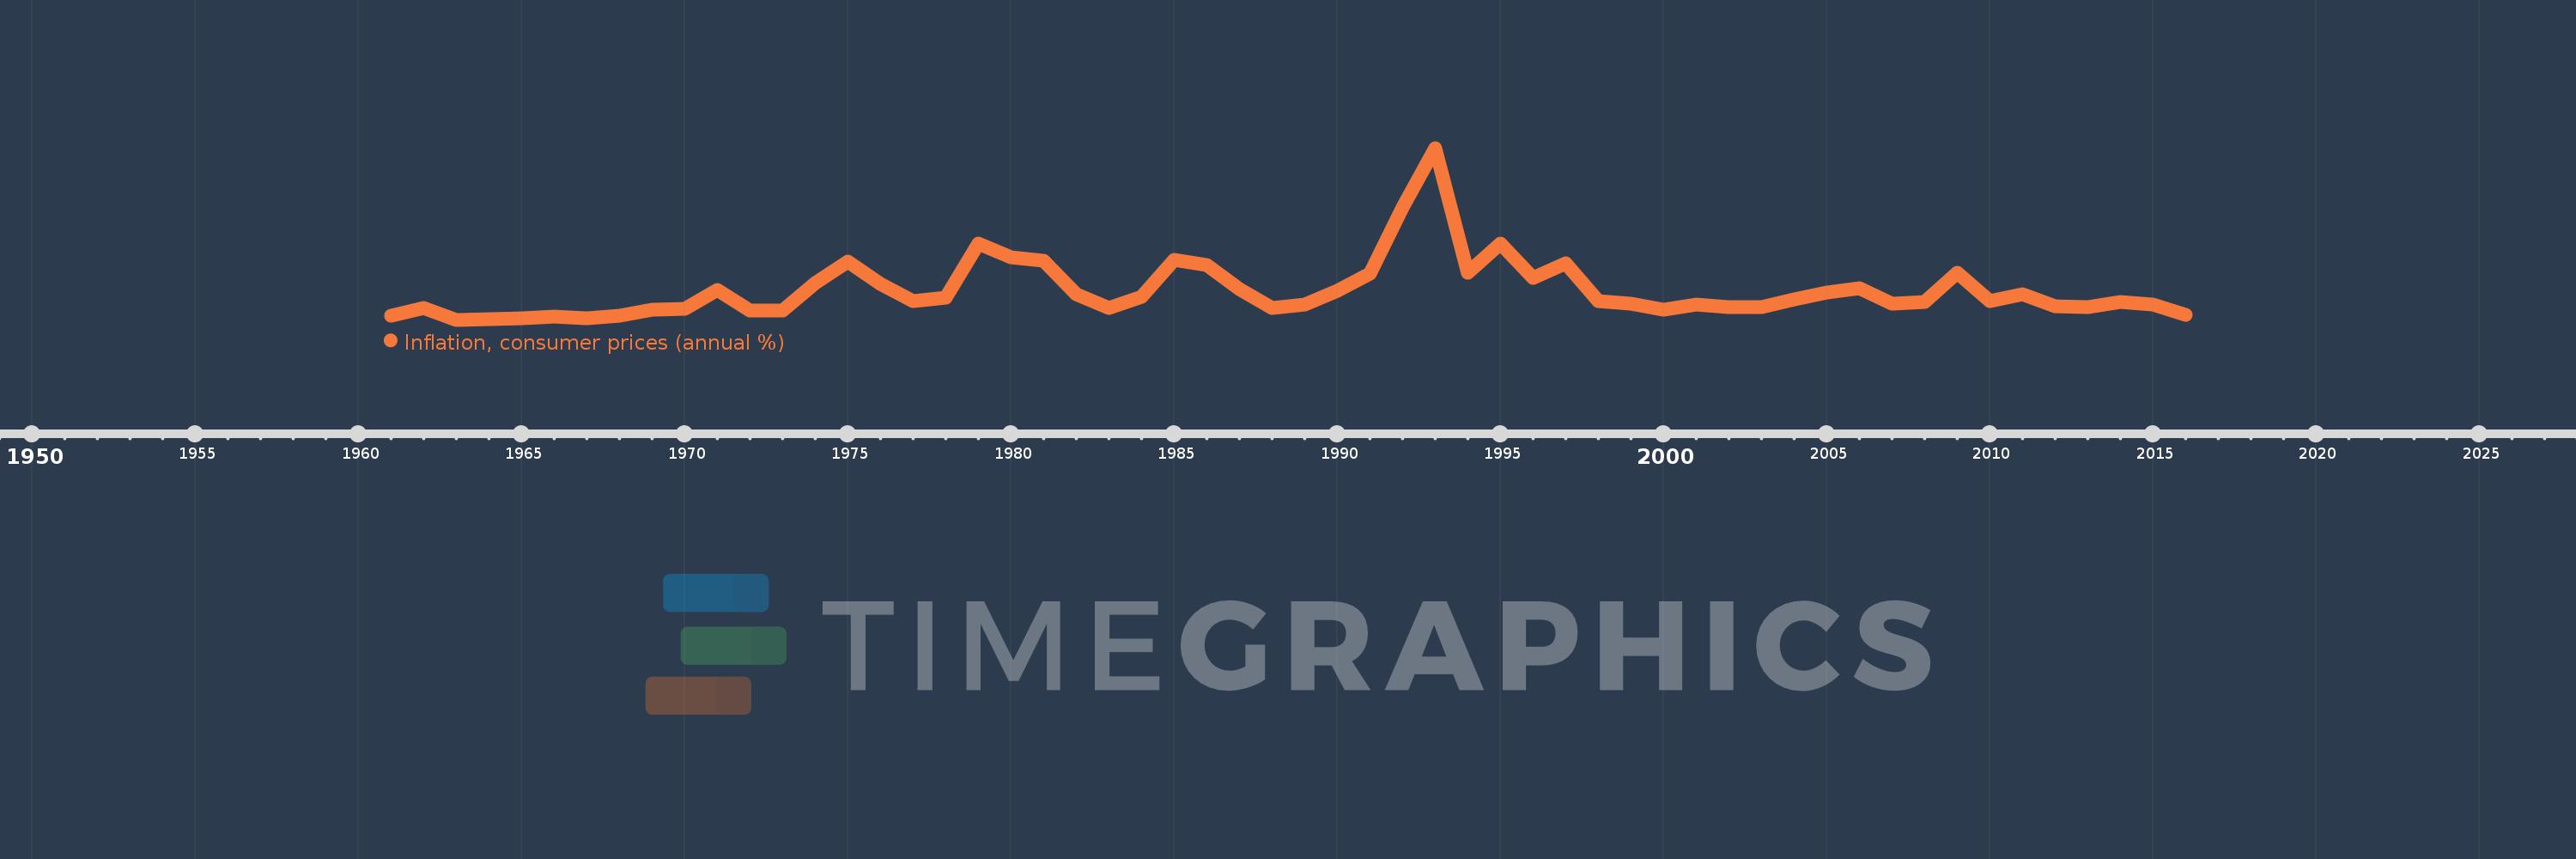
Inflation, consumer prices (annual %)
2016,2015,2014,2013,2012,2011,2010,2009,2008,2007,2006,2005,2004,2003,2002,2001,2000,1999,1998,1997,1996,1995,1994,1993,1992,1991,1990,1989,1988,1987,1986,1985,1984,1983,1982,1981,1980,1979,1978,1977,1976,1975,1974,1973,1972,1971,1970,1969,1968,1967,1966,1965,1964,1963,1962,1961
This statistics in other country:
AfghanistanAlbaniaAlgeriaAngolaAntigua and BarbudaArab WorldArgentinaArmeniaArubaAustraliaAustriaAzerbaijanBahamas, TheBahrainBangladeshBarbadosBelarusBelgiumBelizeBeninBhutanBoliviaBotswanaBrazilBrunei DarussalamBulgariaBurkina FasoBurundiCabo VerdeCambodiaCameroonCanadaCaribbean small statesCentral African RepublicCentral Europe and the BalticsChadChileChinaColombiaComorosCongo, Dem. Rep.Congo, Rep.Costa RicaCote d'IvoireCroatiaCyprusCzech RepublicDenmarkDjiboutiDominicaDominican RepublicEarly-demographic dividendEast Asia & PacificEast Asia & Pacific (excluding high income)East Asia & Pacific (IDA & IBRD countries)EcuadorEgypt, Arab Rep.El SalvadorEquatorial GuineaEstoniaEthiopiaEuro areaEurope & Central AsiaEurope & Central Asia (excluding high income)Europe & Central Asia (IDA & IBRD countries)European UnionFijiFinlandFragile and conflict affected situationsFranceGabonGambia, TheGeorgiaGermanyGhanaGreeceGrenadaGuatemalaGuineaGuinea-BissauGuyanaHaitiHeavily indebted poor countries (HIPC)High incomeHondurasHong Kong SAR, ChinaHungaryIBRD onlyIcelandIDA & IBRD totalIDA blendIDA onlyIDA totalIndiaIndonesiaIran, Islamic Rep.IraqIrelandIsraelItalyJamaicaJapanJordanKazakhstanKenyaKorea, Rep.KuwaitKyrgyz RepublicLao PDRLate-demographic dividendLatin America & Caribbean Latin America & Caribbean (excluding high income)Latin America & the Caribbean (IDA & IBRD countries)LatviaLeast developed countries: UN classificationLebanonLesothoLiberiaLibyaLithuaniaLow & middle incomeLow incomeLower middle incomeLuxembourgMacao SAR, ChinaMacedonia, FYRMadagascarMalawiMalaysiaMaldivesMaliMaltaMauritaniaMauritiusMexicoMiddle East & North AfricaMiddle East & North Africa (excluding high income)Middle East & North Africa (IDA & IBRD countries)Middle incomeMoldovaMongoliaMontenegroMoroccoMozambiqueMyanmarNamibiaNepalNetherlandsNew ZealandNicaraguaNigerNigeriaNorth AmericaNorwayOECD membersOmanOther small statesPakistanPanamaPapua New GuineaParaguayPeruPhilippinesPolandPortugalPost-demographic dividendPre-demographic dividendQatarRomaniaRussian FederationRwandaSamoaSao Tome and PrincipeSaudi ArabiaSenegalSerbiaSeychellesSierra LeoneSingaporeSlovak RepublicSloveniaSmall statesSolomon IslandsSouth AfricaSouth AsiaSouth Asia (IDA & IBRD)South SudanSpainSri LankaSt. Kitts and NevisSt. LuciaSt. Vincent and the GrenadinesSub-Saharan Africa Sub-Saharan Africa (excluding high income)Sub-Saharan Africa (IDA & IBRD countries)SudanSurinameSwazilandSwedenSwitzerlandSyrian Arab RepublicTajikistanTanzaniaThailandTimor-LesteTogoTongaTrinidad and TobagoTunisiaTurkeyUgandaUkraineUnited KingdomUnited StatesUpper middle incomeUruguayVanuatuVenezuela, RBVietnamWorldYemen, Rep.ZambiaZimbabwe Timeline:
This timeline shows a graph from 1961 to 2016 of Jamaica. No data until 1960. Number of actual observations by date: 56.
Source name:
World Development Indicators
Source organization:
International Monetary Fund, International Financial Statistics and data files.
Categories, topics:
Economy & Growth, Financial Sector
Last updated:
apr 23, 2017
Indicators value changes by year
Maximum:
77.297
jan 1, 1993
At the date of observation
Value
Absolute change
Change from previous value
jan 1, 1961
3.274
+3.274
0.0%
jan 1, 1962
6.698
+3.424
104.58%
jan 1, 1963
1.408
-5.291
-78.99%
jan 1, 1964
1.763
+0.355
25.22%
jan 1, 1965
2.013
+0.251
14.24%
jan 1, 1966
2.632
+0.618
30.7%
jan 1, 1967
1.902
-0.729
-27.71%
jan 1, 1968
3.024
+1.121
58.93%
jan 1, 1969
5.929
+2.905
96.08%
jan 1, 1970
6.303
+0.375
6.32%
jan 1, 1971
14.728
+8.425
133.65%
jan 1, 1972
5.336
-9.392
-63.77%
jan 1, 1973
5.428
+0.092
1.72%
jan 1, 1974
17.683
+12.255
225.78%
jan 1, 1975
27.158
+9.476
53.59%
jan 1, 1976
17.376
-9.782
-36.02%
jan 1, 1977
9.794
-7.582
-43.64%
jan 1, 1978
11.191
+1.397
14.27%
jan 1, 1979
34.9
+23.709
211.86%
jan 1, 1980
29.079
-5.821
-16.68%
jan 1, 1981
27.308
-1.771
-6.09%
jan 1, 1982
12.74
-14.568
-53.35%
jan 1, 1983
6.545
-6.194
-48.62%
jan 1, 1984
11.582
+5.037
76.95%
jan 1, 1985
27.815
+16.233
140.15%
jan 1, 1986
25.673
-2.142
-7.7%
jan 1, 1987
15.105
-10.568
-41.16%
jan 1, 1988
6.652
-8.453
-55.96%
jan 1, 1989
8.267
+1.614
24.27%
jan 1, 1990
14.33
+6.063
73.34%
jan 1, 1991
21.96
+7.631
53.25%
jan 1, 1992
51.071
+29.111
132.56%
jan 1, 1993
77.297
+26.225
51.35%
jan 1, 1994
22.07
-55.227
-71.45%
jan 1, 1995
35.063
+12.993
58.87%
jan 1, 1996
19.909
-15.155
-43.22%
jan 1, 1997
26.407
+6.498
32.64%
jan 1, 1998
9.658
-16.749
-63.43%
jan 1, 1999
8.632
-1.026
-10.62%
jan 1, 2000
5.954
-2.678
-31.02%
jan 1, 2001
8.171
+2.217
37.23%
jan 1, 2002
6.991
-1.18
-14.45%
jan 1, 2003
7.077
+0.087
1.24%
jan 1, 2004
10.322
+3.245
45.84%
jan 1, 2005
13.626
+3.304
32.01%
jan 1, 2006
15.296
+1.67
12.26%
jan 1, 2007
8.592
-6.704
-43.83%
jan 1, 2008
9.293
+0.701
8.16%
jan 1, 2009
22.021
+12.728
136.96%
jan 1, 2010
9.574
-12.447
-56.52%
jan 1, 2011
12.61
+3.036
31.71%
jan 1, 2012
7.53
-5.08
-40.29%
jan 1, 2013
6.898
-0.631
-8.39%
jan 1, 2014
9.344
+2.446
35.46%
jan 1, 2015
8.29
-1.054
-11.28%
jan 1, 2016
3.677
-4.613
-55.64%
Ranking of countries by current statistics by years


Comments: