29
/
en
AIzaSyAYiBZKx7MnpbEhh9jyipgxe19OcubqV5w
April 1, 2024
160623
Israel
ISR
true
2
1
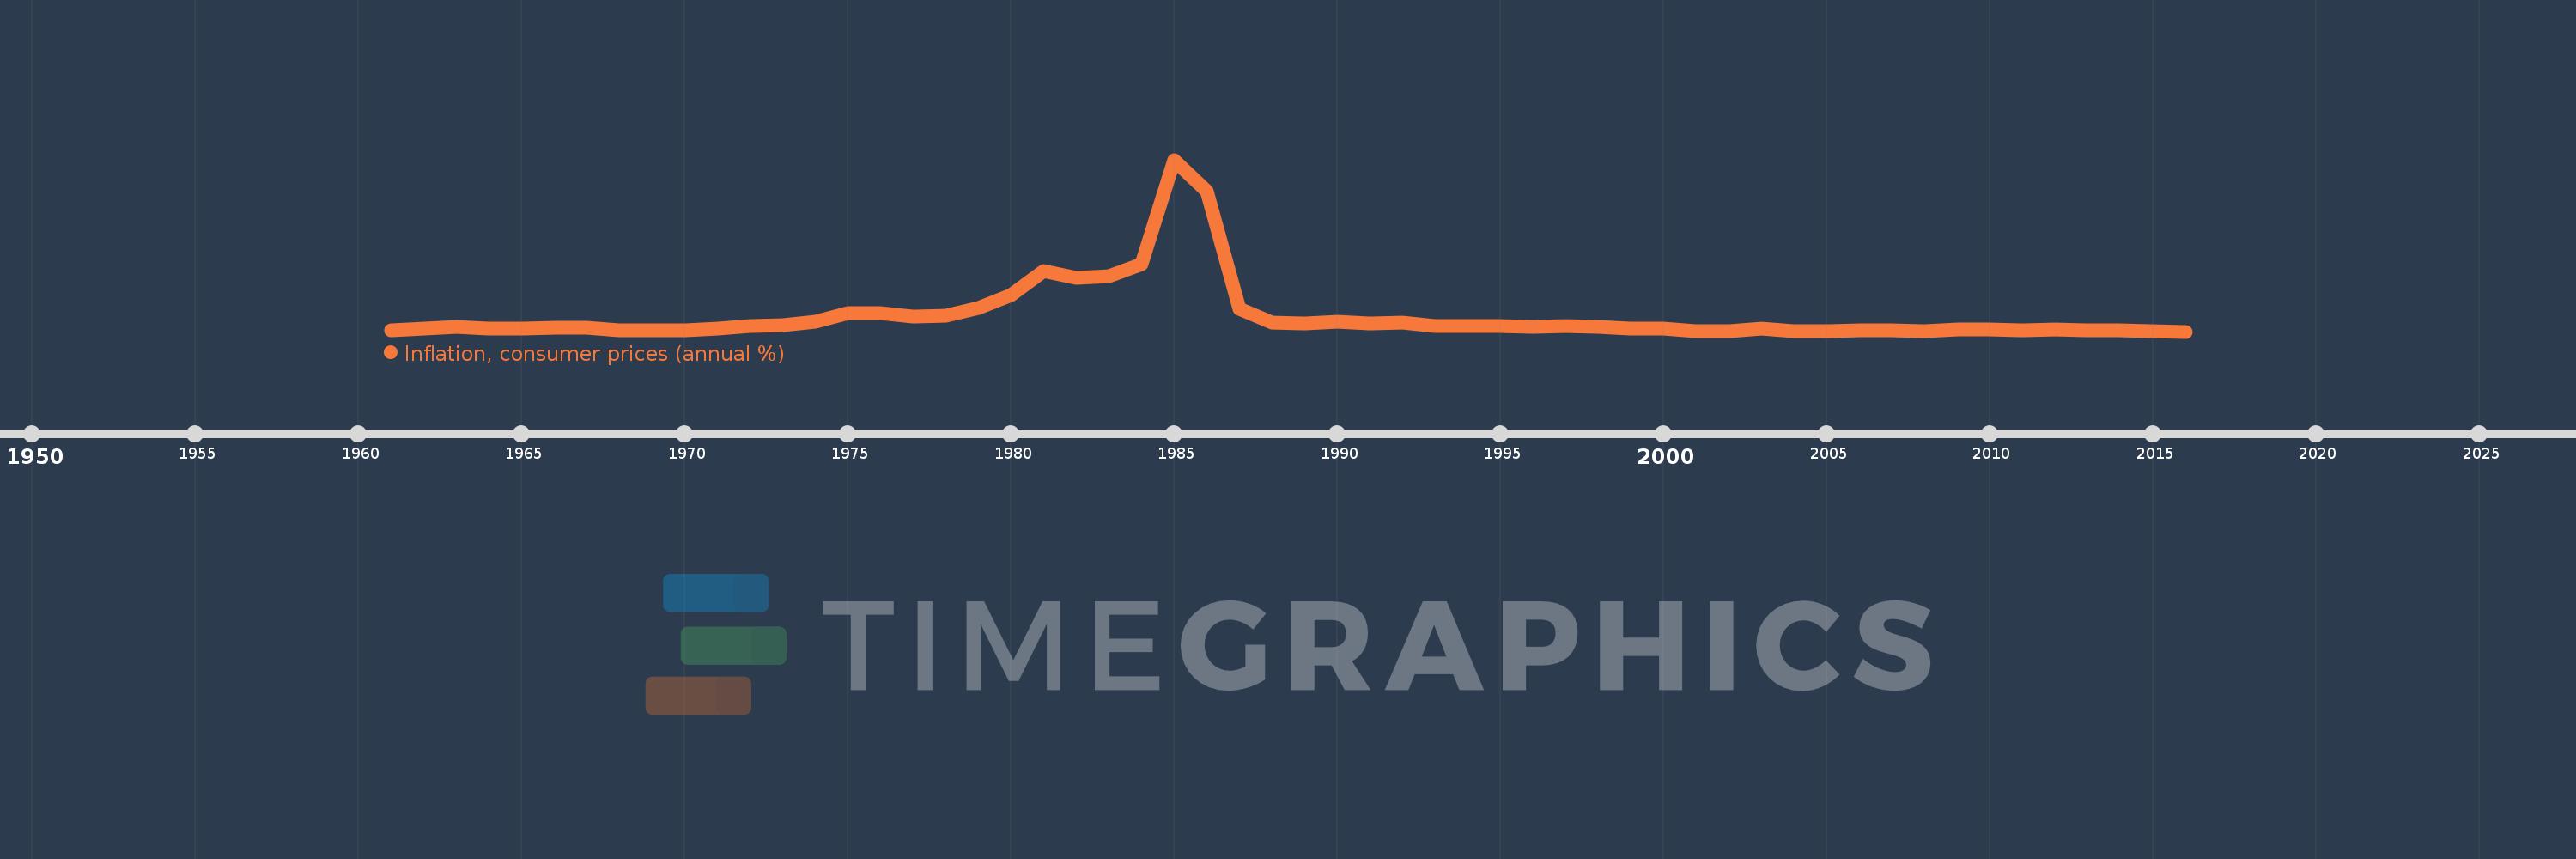
Inflation, consumer prices (annual %)
2016,2015,2014,2013,2012,2011,2010,2009,2008,2007,2006,2005,2004,2003,2002,2001,2000,1999,1998,1997,1996,1995,1994,1993,1992,1991,1990,1989,1988,1987,1986,1985,1984,1983,1982,1981,1980,1979,1978,1977,1976,1975,1974,1973,1972,1971,1970,1969,1968,1967,1966,1965,1964,1963,1962,1961
This statistics in other country:
AfghanistanAlbaniaAlgeriaAngolaAntigua and BarbudaArab WorldArgentinaArmeniaArubaAustraliaAustriaAzerbaijanBahamas, TheBahrainBangladeshBarbadosBelarusBelgiumBelizeBeninBhutanBoliviaBotswanaBrazilBrunei DarussalamBulgariaBurkina FasoBurundiCabo VerdeCambodiaCameroonCanadaCaribbean small statesCentral African RepublicCentral Europe and the BalticsChadChileChinaColombiaComorosCongo, Dem. Rep.Congo, Rep.Costa RicaCote d'IvoireCroatiaCyprusCzech RepublicDenmarkDjiboutiDominicaDominican RepublicEarly-demographic dividendEast Asia & PacificEast Asia & Pacific (excluding high income)East Asia & Pacific (IDA & IBRD countries)EcuadorEgypt, Arab Rep.El SalvadorEquatorial GuineaEstoniaEthiopiaEuro areaEurope & Central AsiaEurope & Central Asia (excluding high income)Europe & Central Asia (IDA & IBRD countries)European UnionFijiFinlandFragile and conflict affected situationsFranceGabonGambia, TheGeorgiaGermanyGhanaGreeceGrenadaGuatemalaGuineaGuinea-BissauGuyanaHaitiHeavily indebted poor countries (HIPC)High incomeHondurasHong Kong SAR, ChinaHungaryIBRD onlyIcelandIDA & IBRD totalIDA blendIDA onlyIDA totalIndiaIndonesiaIran, Islamic Rep.IraqIrelandIsraelItalyJamaicaJapanJordanKazakhstanKenyaKorea, Rep.KuwaitKyrgyz RepublicLao PDRLate-demographic dividendLatin America & Caribbean Latin America & Caribbean (excluding high income)Latin America & the Caribbean (IDA & IBRD countries)LatviaLeast developed countries: UN classificationLebanonLesothoLiberiaLibyaLithuaniaLow & middle incomeLow incomeLower middle incomeLuxembourgMacao SAR, ChinaMacedonia, FYRMadagascarMalawiMalaysiaMaldivesMaliMaltaMauritaniaMauritiusMexicoMiddle East & North AfricaMiddle East & North Africa (excluding high income)Middle East & North Africa (IDA & IBRD countries)Middle incomeMoldovaMongoliaMontenegroMoroccoMozambiqueMyanmarNamibiaNepalNetherlandsNew ZealandNicaraguaNigerNigeriaNorth AmericaNorwayOECD membersOmanOther small statesPakistanPanamaPapua New GuineaParaguayPeruPhilippinesPolandPortugalPost-demographic dividendPre-demographic dividendQatarRomaniaRussian FederationRwandaSamoaSao Tome and PrincipeSaudi ArabiaSenegalSerbiaSeychellesSierra LeoneSingaporeSlovak RepublicSloveniaSmall statesSolomon IslandsSouth AfricaSouth AsiaSouth Asia (IDA & IBRD)South SudanSpainSri LankaSt. Kitts and NevisSt. LuciaSt. Vincent and the GrenadinesSub-Saharan Africa Sub-Saharan Africa (excluding high income)Sub-Saharan Africa (IDA & IBRD countries)SudanSurinameSwazilandSwedenSwitzerlandSyrian Arab RepublicTajikistanTanzaniaThailandTimor-LesteTogoTongaTrinidad and TobagoTunisiaTurkeyUgandaUkraineUnited KingdomUnited StatesUpper middle incomeUruguayVanuatuVenezuela, RBVietnamWorldYemen, Rep.ZambiaZimbabwe Timeline:
This timeline shows a graph from 1961 to 2016 of Israel. No data until 1960. Number of actual observations by date: 56.
Source name:
World Development Indicators
Source organization:
International Monetary Fund, International Financial Statistics and data files.
Categories, topics:
Economy & Growth, Financial Sector
Last updated:
apr 23, 2017
Indicators value changes by year
Minimum:
-0.633
jan 1, 2016
Maximum:
373.821
jan 1, 1985
At the date of observation
Value
Absolute change
Change from previous value
jan 1, 1961
2.228
+2.228
0.0%
jan 1, 1962
6.79
+4.562
204.73%
jan 1, 1963
9.408
+2.618
38.56%
jan 1, 1964
6.581
-2.827
-30.05%
jan 1, 1965
5.173
-1.408
-21.4%
jan 1, 1966
7.708
+2.536
49.02%
jan 1, 1967
7.93
+0.222
2.88%
jan 1, 1968
1.706
-6.224
-78.49%
jan 1, 1969
2.079
+0.373
21.87%
jan 1, 1970
2.458
+0.379
18.22%
jan 1, 1971
6.111
+3.653
148.6%
jan 1, 1972
11.973
+5.862
95.93%
jan 1, 1973
12.881
+0.909
7.59%
jan 1, 1974
20.032
+7.151
55.51%
jan 1, 1975
39.68
+19.648
98.08%
jan 1, 1976
39.307
-0.373
-0.94%
jan 1, 1977
31.311
-7.996
-20.34%
jan 1, 1978
34.617
+3.306
10.56%
jan 1, 1979
50.551
+15.934
46.03%
jan 1, 1980
78.31
+27.759
54.91%
jan 1, 1981
131.025
+52.715
67.32%
jan 1, 1982
116.809
-14.216
-10.85%
jan 1, 1983
120.364
+3.556
3.04%
jan 1, 1984
145.638
+25.273
21.0%
jan 1, 1985
373.821
+228.183
156.68%
jan 1, 1986
304.584
-69.236
-18.52%
jan 1, 1987
48.155
-256.429
-84.19%
jan 1, 1988
19.853
-28.303
-58.77%
jan 1, 1989
16.231
-3.622
-18.24%
jan 1, 1990
20.249
+4.018
24.76%
jan 1, 1991
17.173
-3.076
-15.19%
jan 1, 1992
19.006
+1.833
10.67%
jan 1, 1993
11.948
-7.058
-37.14%
jan 1, 1994
10.944
-1.004
-8.4%
jan 1, 1995
12.342
+1.398
12.78%
jan 1, 1996
10.043
-2.299
-18.63%
jan 1, 1997
11.277
+1.234
12.28%
jan 1, 1998
9.001
-2.275
-20.18%
jan 1, 1999
5.435
-3.566
-39.62%
jan 1, 2000
5.194
-0.24
-4.42%
jan 1, 2001
1.125
-4.07
-78.35%
jan 1, 2002
1.116
-0.009
-0.8%
jan 1, 2003
5.687
+4.572
409.7%
jan 1, 2004
0.67
-5.018
-88.23%
jan 1, 2005
-0.414
-1.083
-161.79%
jan 1, 2006
1.327
+1.74
-420.67%
jan 1, 2007
2.114
+0.788
59.37%
jan 1, 2008
0.51
-1.604
-75.87%
jan 1, 2009
4.597
+4.087
801.28%
jan 1, 2010
3.325
-1.272
-27.68%
jan 1, 2011
2.693
-0.632
-19.01%
jan 1, 2012
3.459
+0.766
28.45%
jan 1, 2013
1.708
-1.752
-50.64%
jan 1, 2014
1.526
-0.182
-10.64%
jan 1, 2015
0.476
-1.05
-68.81%
jan 1, 2016
-0.633
-1.109
-233.02%
Ranking of countries by current statistics by years


Comments: