29
/
en
AIzaSyAYiBZKx7MnpbEhh9jyipgxe19OcubqV5w
April 1, 2024
180051
Libya
LBY
true
2
1
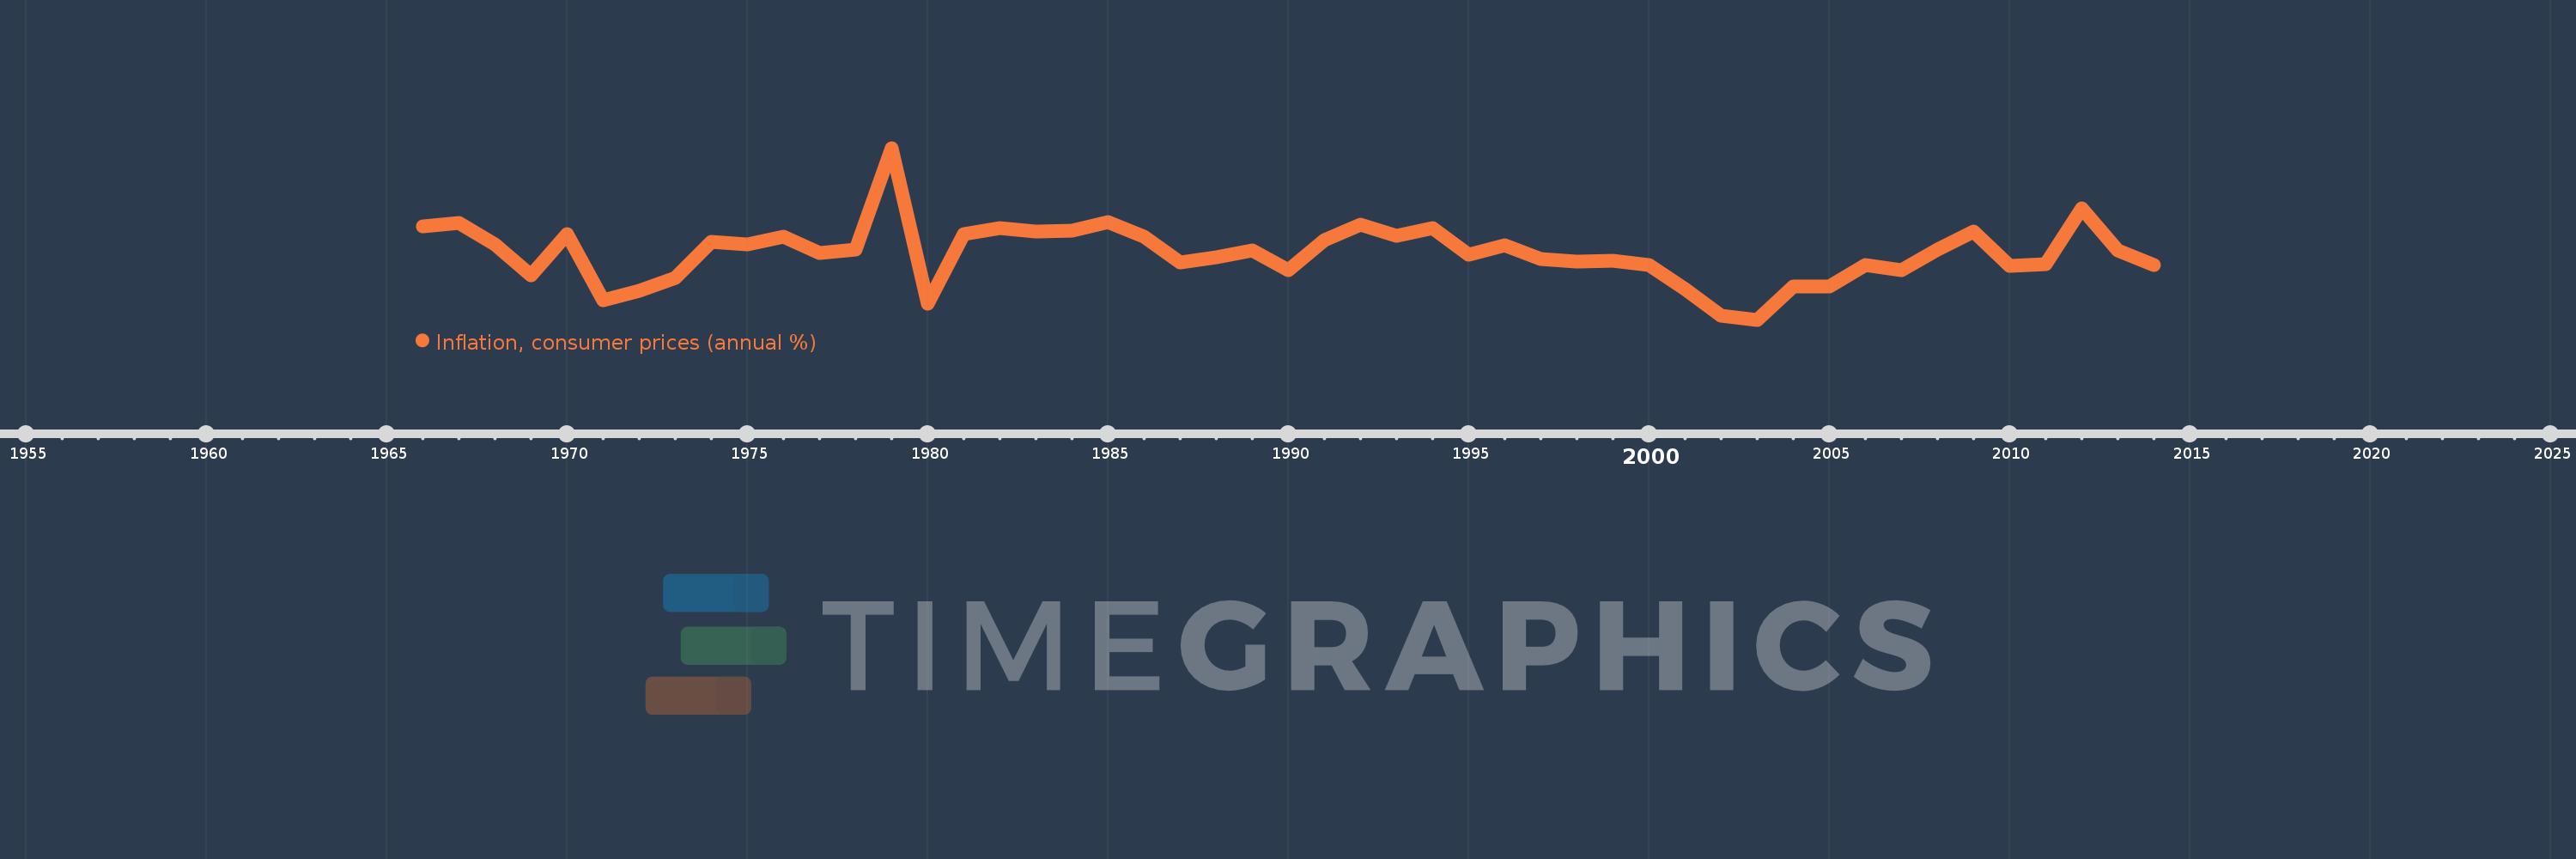
Inflation, consumer prices (annual %)
2014,2013,2012,2011,2010,2009,2008,2007,2006,2005,2004,2003,2002,2001,2000,1999,1998,1997,1996,1995,1994,1993,1992,1991,1990,1989,1988,1987,1986,1985,1984,1983,1982,1981,1980,1979,1978,1977,1976,1975,1974,1973,1972,1971,1970,1969,1968,1967,1966
This statistics in other country:
AfghanistanAlbaniaAlgeriaAngolaAntigua and BarbudaArab WorldArgentinaArmeniaArubaAustraliaAustriaAzerbaijanBahamas, TheBahrainBangladeshBarbadosBelarusBelgiumBelizeBeninBhutanBoliviaBotswanaBrazilBrunei DarussalamBulgariaBurkina FasoBurundiCabo VerdeCambodiaCameroonCanadaCaribbean small statesCentral African RepublicCentral Europe and the BalticsChadChileChinaColombiaComorosCongo, Dem. Rep.Congo, Rep.Costa RicaCote d'IvoireCroatiaCyprusCzech RepublicDenmarkDjiboutiDominicaDominican RepublicEarly-demographic dividendEast Asia & PacificEast Asia & Pacific (excluding high income)East Asia & Pacific (IDA & IBRD countries)EcuadorEgypt, Arab Rep.El SalvadorEquatorial GuineaEstoniaEthiopiaEuro areaEurope & Central AsiaEurope & Central Asia (excluding high income)Europe & Central Asia (IDA & IBRD countries)European UnionFijiFinlandFragile and conflict affected situationsFranceGabonGambia, TheGeorgiaGermanyGhanaGreeceGrenadaGuatemalaGuineaGuinea-BissauGuyanaHaitiHeavily indebted poor countries (HIPC)High incomeHondurasHong Kong SAR, ChinaHungaryIBRD onlyIcelandIDA & IBRD totalIDA blendIDA onlyIDA totalIndiaIndonesiaIran, Islamic Rep.IraqIrelandIsraelItalyJamaicaJapanJordanKazakhstanKenyaKorea, Rep.KuwaitKyrgyz RepublicLao PDRLate-demographic dividendLatin America & Caribbean Latin America & Caribbean (excluding high income)Latin America & the Caribbean (IDA & IBRD countries)LatviaLeast developed countries: UN classificationLebanonLesothoLiberiaLibyaLithuaniaLow & middle incomeLow incomeLower middle incomeLuxembourgMacao SAR, ChinaMacedonia, FYRMadagascarMalawiMalaysiaMaldivesMaliMaltaMauritaniaMauritiusMexicoMiddle East & North AfricaMiddle East & North Africa (excluding high income)Middle East & North Africa (IDA & IBRD countries)Middle incomeMoldovaMongoliaMontenegroMoroccoMozambiqueMyanmarNamibiaNepalNetherlandsNew ZealandNicaraguaNigerNigeriaNorth AmericaNorwayOECD membersOmanOther small statesPakistanPanamaPapua New GuineaParaguayPeruPhilippinesPolandPortugalPost-demographic dividendPre-demographic dividendQatarRomaniaRussian FederationRwandaSamoaSao Tome and PrincipeSaudi ArabiaSenegalSerbiaSeychellesSierra LeoneSingaporeSlovak RepublicSloveniaSmall statesSolomon IslandsSouth AfricaSouth AsiaSouth Asia (IDA & IBRD)South SudanSpainSri LankaSt. Kitts and NevisSt. LuciaSt. Vincent and the GrenadinesSub-Saharan Africa Sub-Saharan Africa (excluding high income)Sub-Saharan Africa (IDA & IBRD countries)SudanSurinameSwazilandSwedenSwitzerlandSyrian Arab RepublicTajikistanTanzaniaThailandTimor-LesteTogoTongaTrinidad and TobagoTunisiaTurkeyUgandaUkraineUnited KingdomUnited StatesUpper middle incomeUruguayVanuatuVenezuela, RBVietnamWorldYemen, Rep.ZambiaZimbabwe Timeline:
This timeline shows a graph from 1966 to 2014 of Libya. No data until 1965. Number of actual observations by date: 49.
Source name:
World Development Indicators
Source organization:
International Monetary Fund, International Financial Statistics and data files.
Categories, topics:
Economy & Growth, Financial Sector
Last updated:
apr 23, 2017
Indicators value changes by year
Minimum:
-9.798
jan 1, 2003
At the date of observation
Value
Absolute change
Change from previous value
jan 1, 1966
11.425
+11.425
0.0%
jan 1, 1967
12.243
+0.818
7.16%
jan 1, 1968
7.296
-4.947
-40.41%
jan 1, 1969
0.391
-6.905
-94.64%
jan 1, 1970
9.786
+9.395
2.4K%
jan 1, 1971
-5.296
-15.082
-154.12%
jan 1, 1972
-3.104
+2.193
-41.4%
jan 1, 1973
-0.251
+2.853
-91.91%
jan 1, 1974
7.971
+8.222
-3.28K%
jan 1, 1975
7.458
-0.512
-6.43%
jan 1, 1976
9.119
+1.661
22.27%
jan 1, 1977
5.479
-3.64
-39.92%
jan 1, 1978
6.28
+0.801
14.62%
jan 1, 1979
29.38
+23.1
367.82%
jan 1, 1980
-6.039
-35.419
-120.56%
jan 1, 1981
9.734
+15.773
-261.19%
jan 1, 1982
11.2
+1.465
15.05%
jan 1, 1983
10.259
-0.941
-8.4%
jan 1, 1984
10.605
+0.346
3.38%
jan 1, 1985
12.478
+1.872
17.66%
jan 1, 1986
9.138
-3.339
-26.76%
jan 1, 1987
3.291
-5.847
-63.99%
jan 1, 1988
4.356
+1.065
32.35%
jan 1, 1989
6.087
+1.731
39.75%
jan 1, 1990
1.512
-4.575
-75.16%
jan 1, 1991
8.451
+6.94
459.02%
jan 1, 1992
11.896
+3.445
40.76%
jan 1, 1993
9.36
-2.536
-21.32%
jan 1, 1994
11.074
+1.714
18.31%
jan 1, 1995
5.113
-5.961
-53.83%
jan 1, 1996
7.238
+2.125
41.57%
jan 1, 1997
4.028
-3.21
-44.35%
jan 1, 1998
3.55
-0.478
-11.86%
jan 1, 1999
3.709
+0.159
4.48%
jan 1, 2000
2.649
-1.061
-28.59%
jan 1, 2001
-2.9
-5.549
-209.49%
jan 1, 2002
-8.814
-5.914
203.93%
jan 1, 2003
-9.798
-0.984
11.16%
jan 1, 2004
-2.191
+7.606
-77.64%
jan 1, 2005
-2.198
-0.006
0.29%
jan 1, 2006
2.65
+4.848
-220.6%
jan 1, 2007
1.459
-1.191
-44.94%
jan 1, 2008
6.251
+4.792
328.36%
jan 1, 2009
10.361
+4.11
65.75%
jan 1, 2010
2.46
-7.901
-76.26%
jan 1, 2011
2.8
+0.34
13.82%
jan 1, 2012
15.518
+12.719
454.25%
jan 1, 2013
6.06
-9.459
-60.95%
jan 1, 2014
2.606
-3.454
-57.0%
Ranking of countries by current statistics by years


Comments: